Maze metrics in Reach
Last updated: September 11, 2026
Maze metrics are stats collected from studies during the course of your Reach campaigns.
You can use these metrics to understand the behavior of your participants, segment your data, and better retarget participants in future campaigns.
Available metrics
Last contacted
This is the date the participant was last sent a campaign via Reach.
You can use this metric to keep track of the most recently contacted participants. This avoids burdening participants with too frequent communications.
Studies sent
This is the number of individual studies sent to a participant via Reach campaigns.
You can use this metric to keep track of the most contacted participants. This helps ensure that you’re reaching out more or less uniformly to all participants in the database instead of disproportionally targeting some participants.
Studies started
This is the total number of studies the participant started via a Reach campaign.
Studies completed
This is the total number of studies the participant completed via a Reach campaign.
Start rate / Response rate
This is the ratio of studies started from received Reach campaigns.
A lower start rate may indicate that participants are not engaging with your Reach campaigns. This could mean that your email subject/copy could use some rework, or that emails are not reaching participants for some reason. Learn more about the deliverability and engagement of Reach campaigns
In some cases, you may also want to exclude these inactive participants. Learn more about deleting participants from your Reach database
Completion rate
This is the ratio of studies completed from received Reach campaigns.
A lower completion rate means that participants are starting the studies, but not finishing them. This may indicate an issue with the setup of the test — for instance, if the study is too long, or if there are problems in conditional logic or the mission setup.
In these cases, it may be worth double-checking your study for issues, and targeting these users for a follow-up campaign, if needed.
Average time to respond / Response time
This is the average time the participant took to start a study after receiving a campaign.
Taking less time to start a study after receiving a campaign email may be an indicator of higher engagement. These participants may be more receptive to testing.
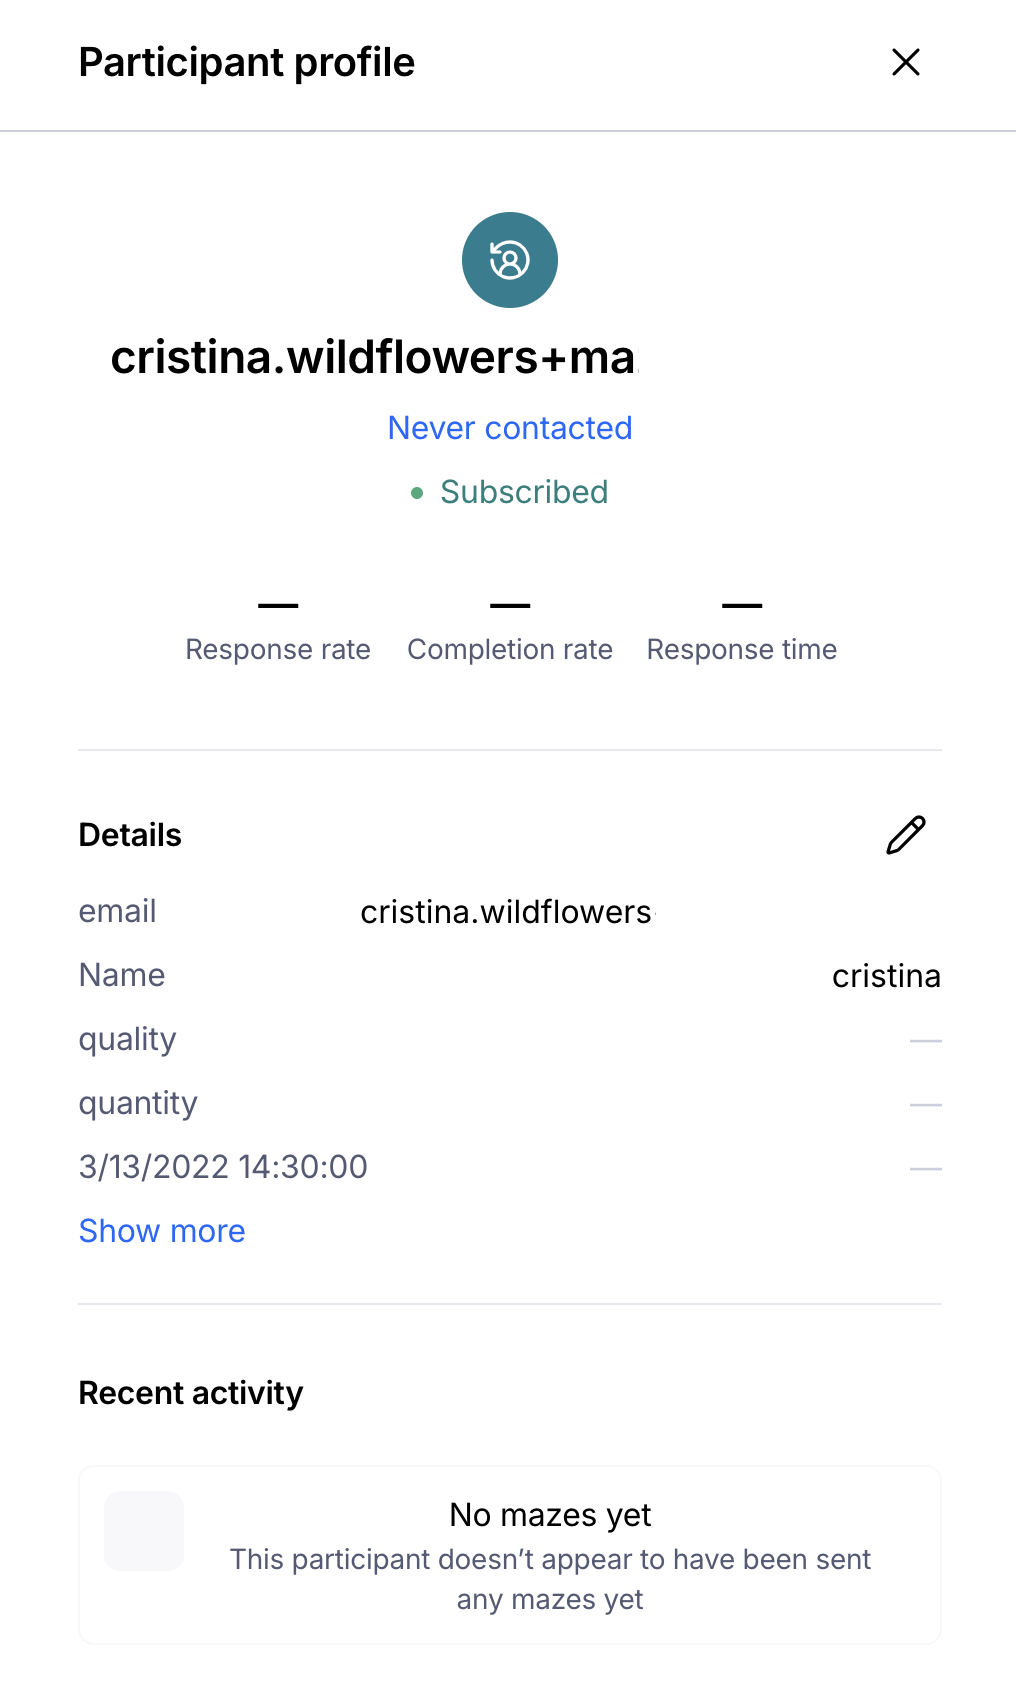
Participant profile
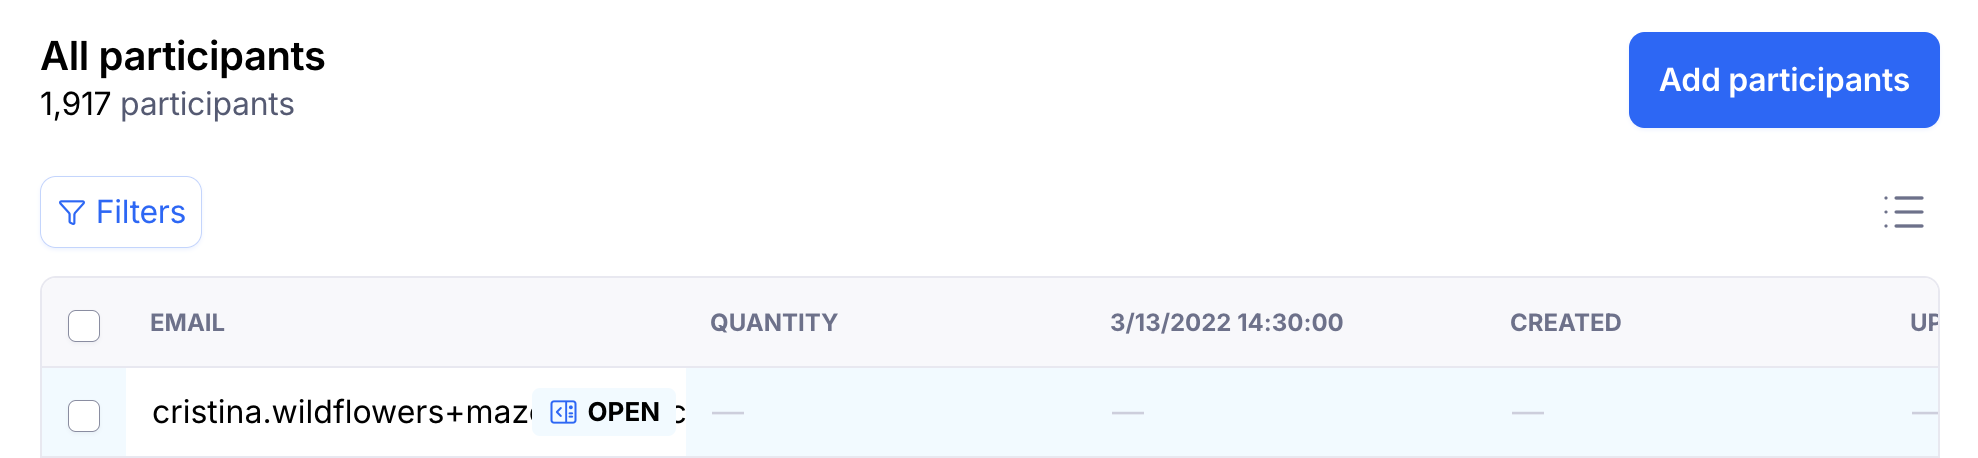
Click the Open button next to each participant to view relevant information about their profile and activity metrics.
Filtering based on metrics
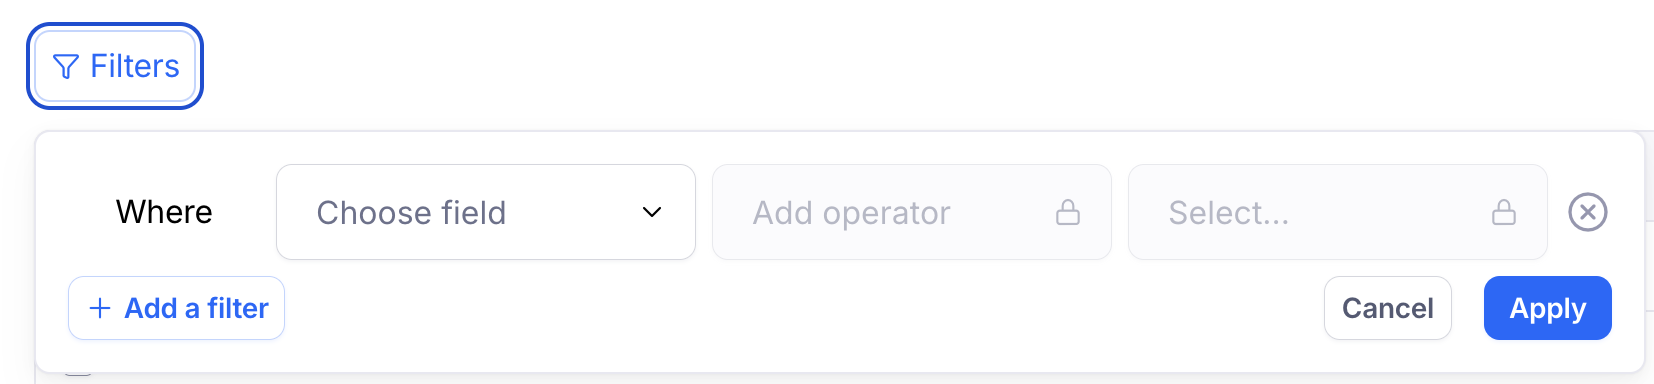
You can use these metrics to create segments that allow you to target specific participant groups more quickly and precisely.
Learn more about filters and segments in Reach
Some examples of segments you could create based on study metrics:
Most responsive participants — e.g. if you want to target participants who are more receptive to testing
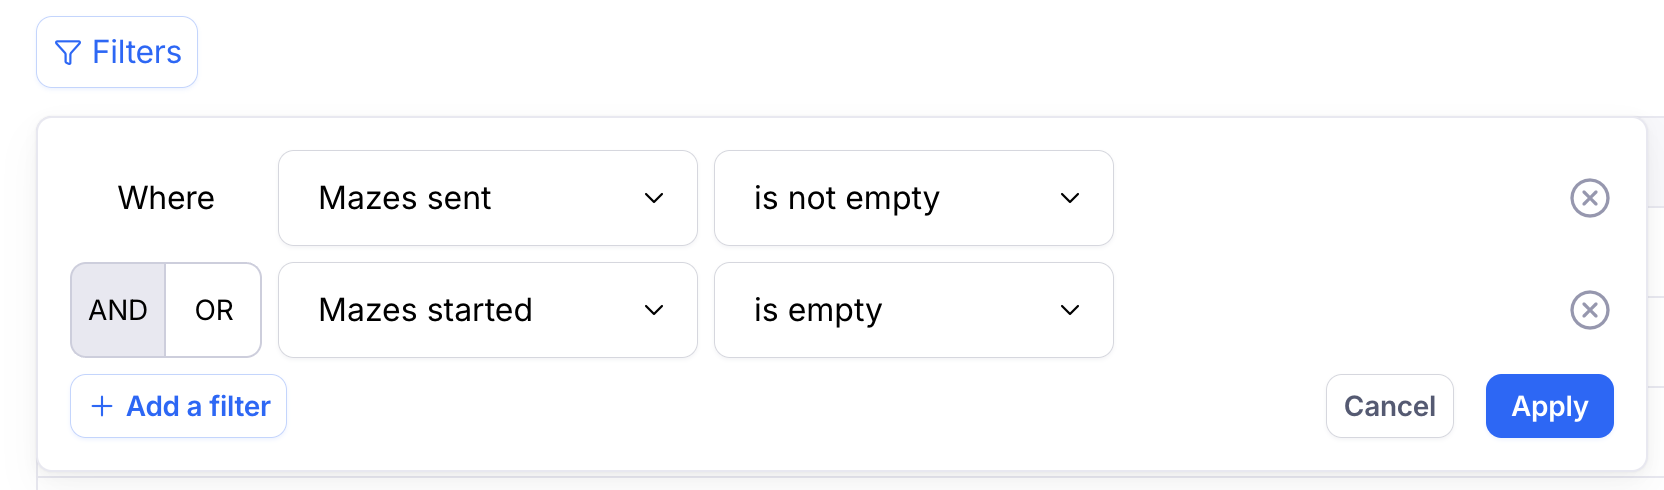
Participants who haven’t been contacted before — e.g. if you want to target first-time participants
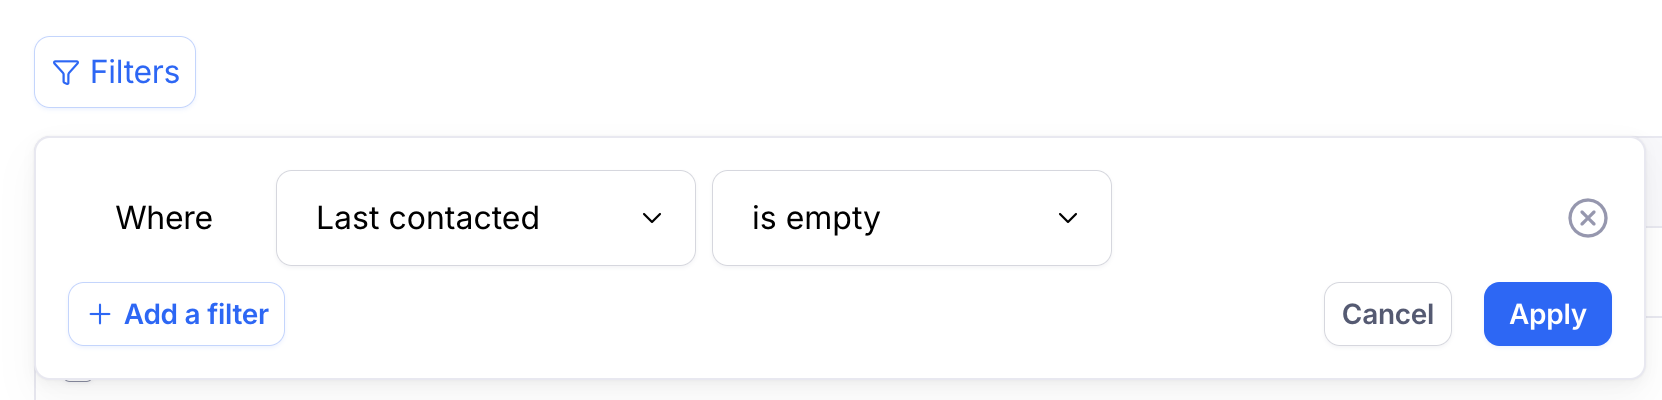
Participants who recently had a zero completion rate — e.g. if you need to send a follow-up campaign due to an issue with the original study
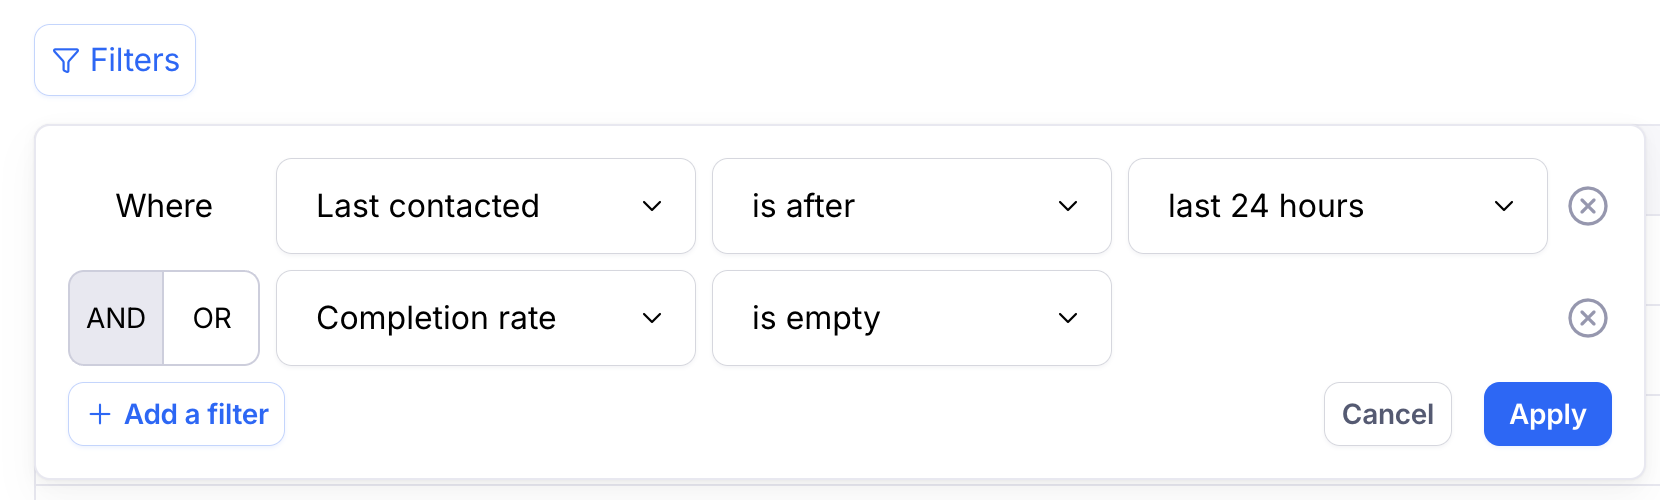
Inactive participants — e.g. if you want to exclude participants who aren’t interacting with your studies