A guide to click heatmaps in Maze
Last updated: April 19, 2026
A click heatmap is a visual representation of where your testers clicked on a particular screen. Click heatmaps give you insight into your testers' behavior in your prototype.
Maze allows you to view the clicks on a screen from each tester on mission/live website testing blocks. When viewing a click heatmap, you can also filter the information to only display the data you need for your analysis.
In this article:
- Access your heatmaps
- Aggregated path heatmaps
- Screen heatmaps
- Individual tester heatmaps
- Filter the information on heatmaps
- Display options
- Screen metrics
- Download heatmaps
Access your heatmaps
To access click heatmaps in Maze, you need to test your live maze with testers. Once you start receiving responses, they will appear on the Results dashboard of your maze.
Click a path or a screen on the Results dashboard in order to view the heatmap. You can see heatmaps for aggregated paths, specific screens, or individual testers.
Aggregated path heatmaps
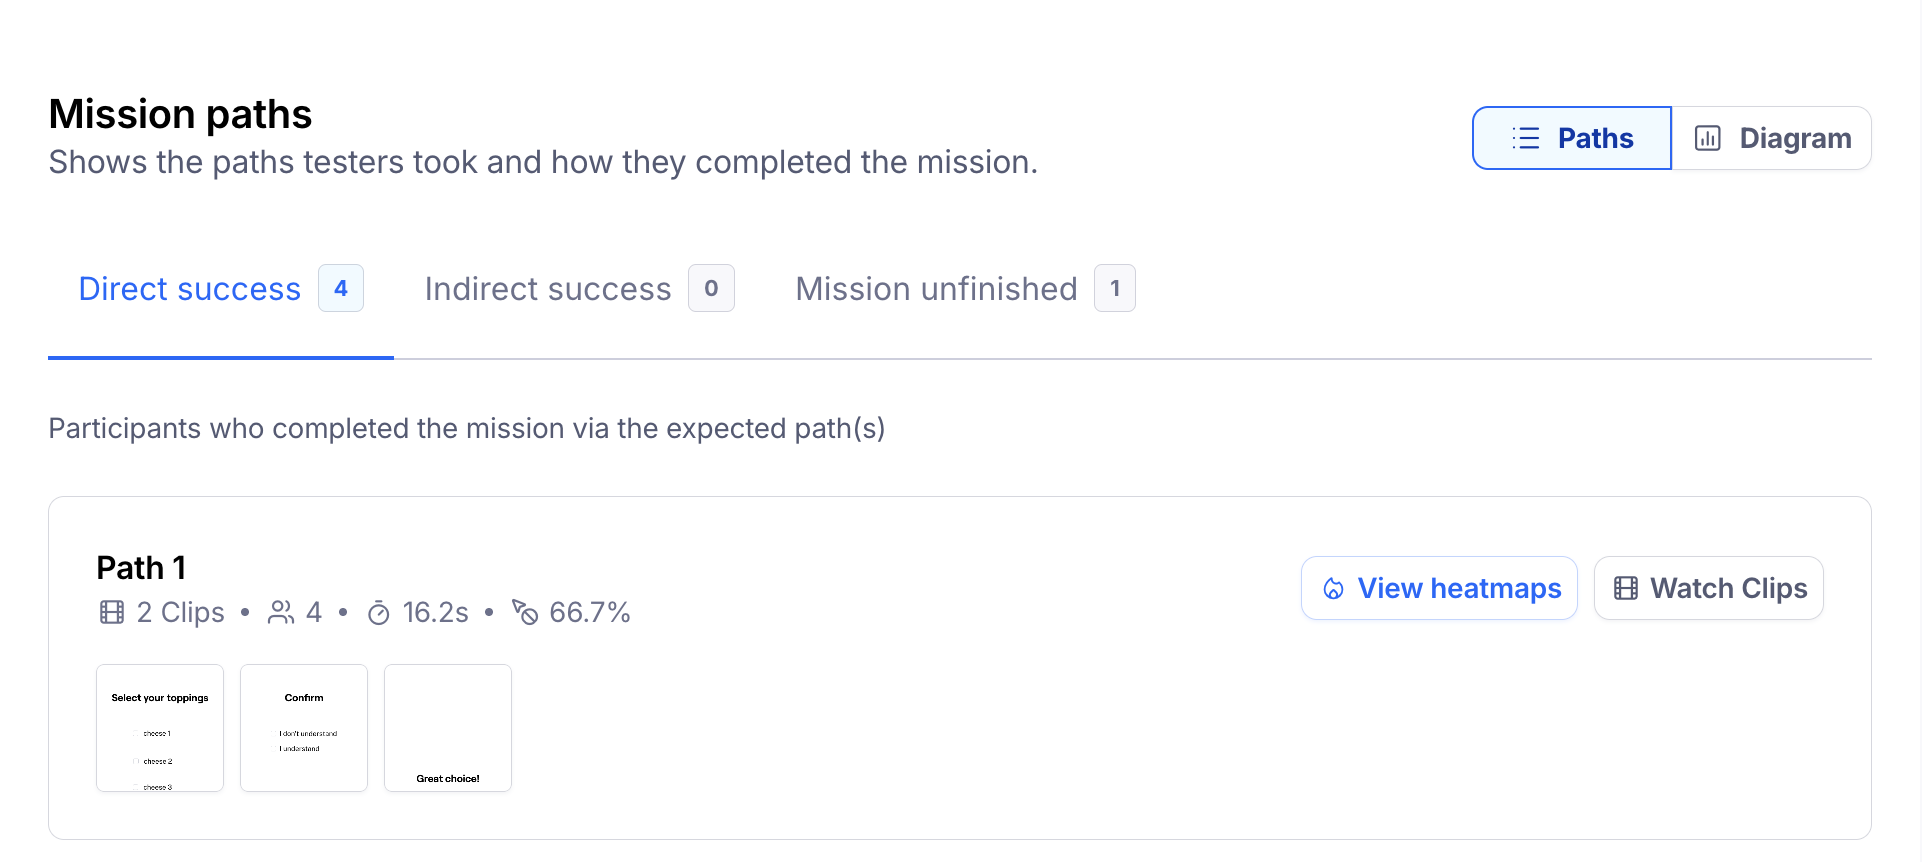
Aggregated path heatmaps display tester clicks based on the mission outcome: direct success, indirect success, or give up/bounce.
To access the aggregated path heatmaps:
- Open the relevant mission block on your Results dashboard.
-
Under the 'Mission paths' section, click View heatmaps.
-
The heatmaps for each screen on that aggregated path will be displayed.
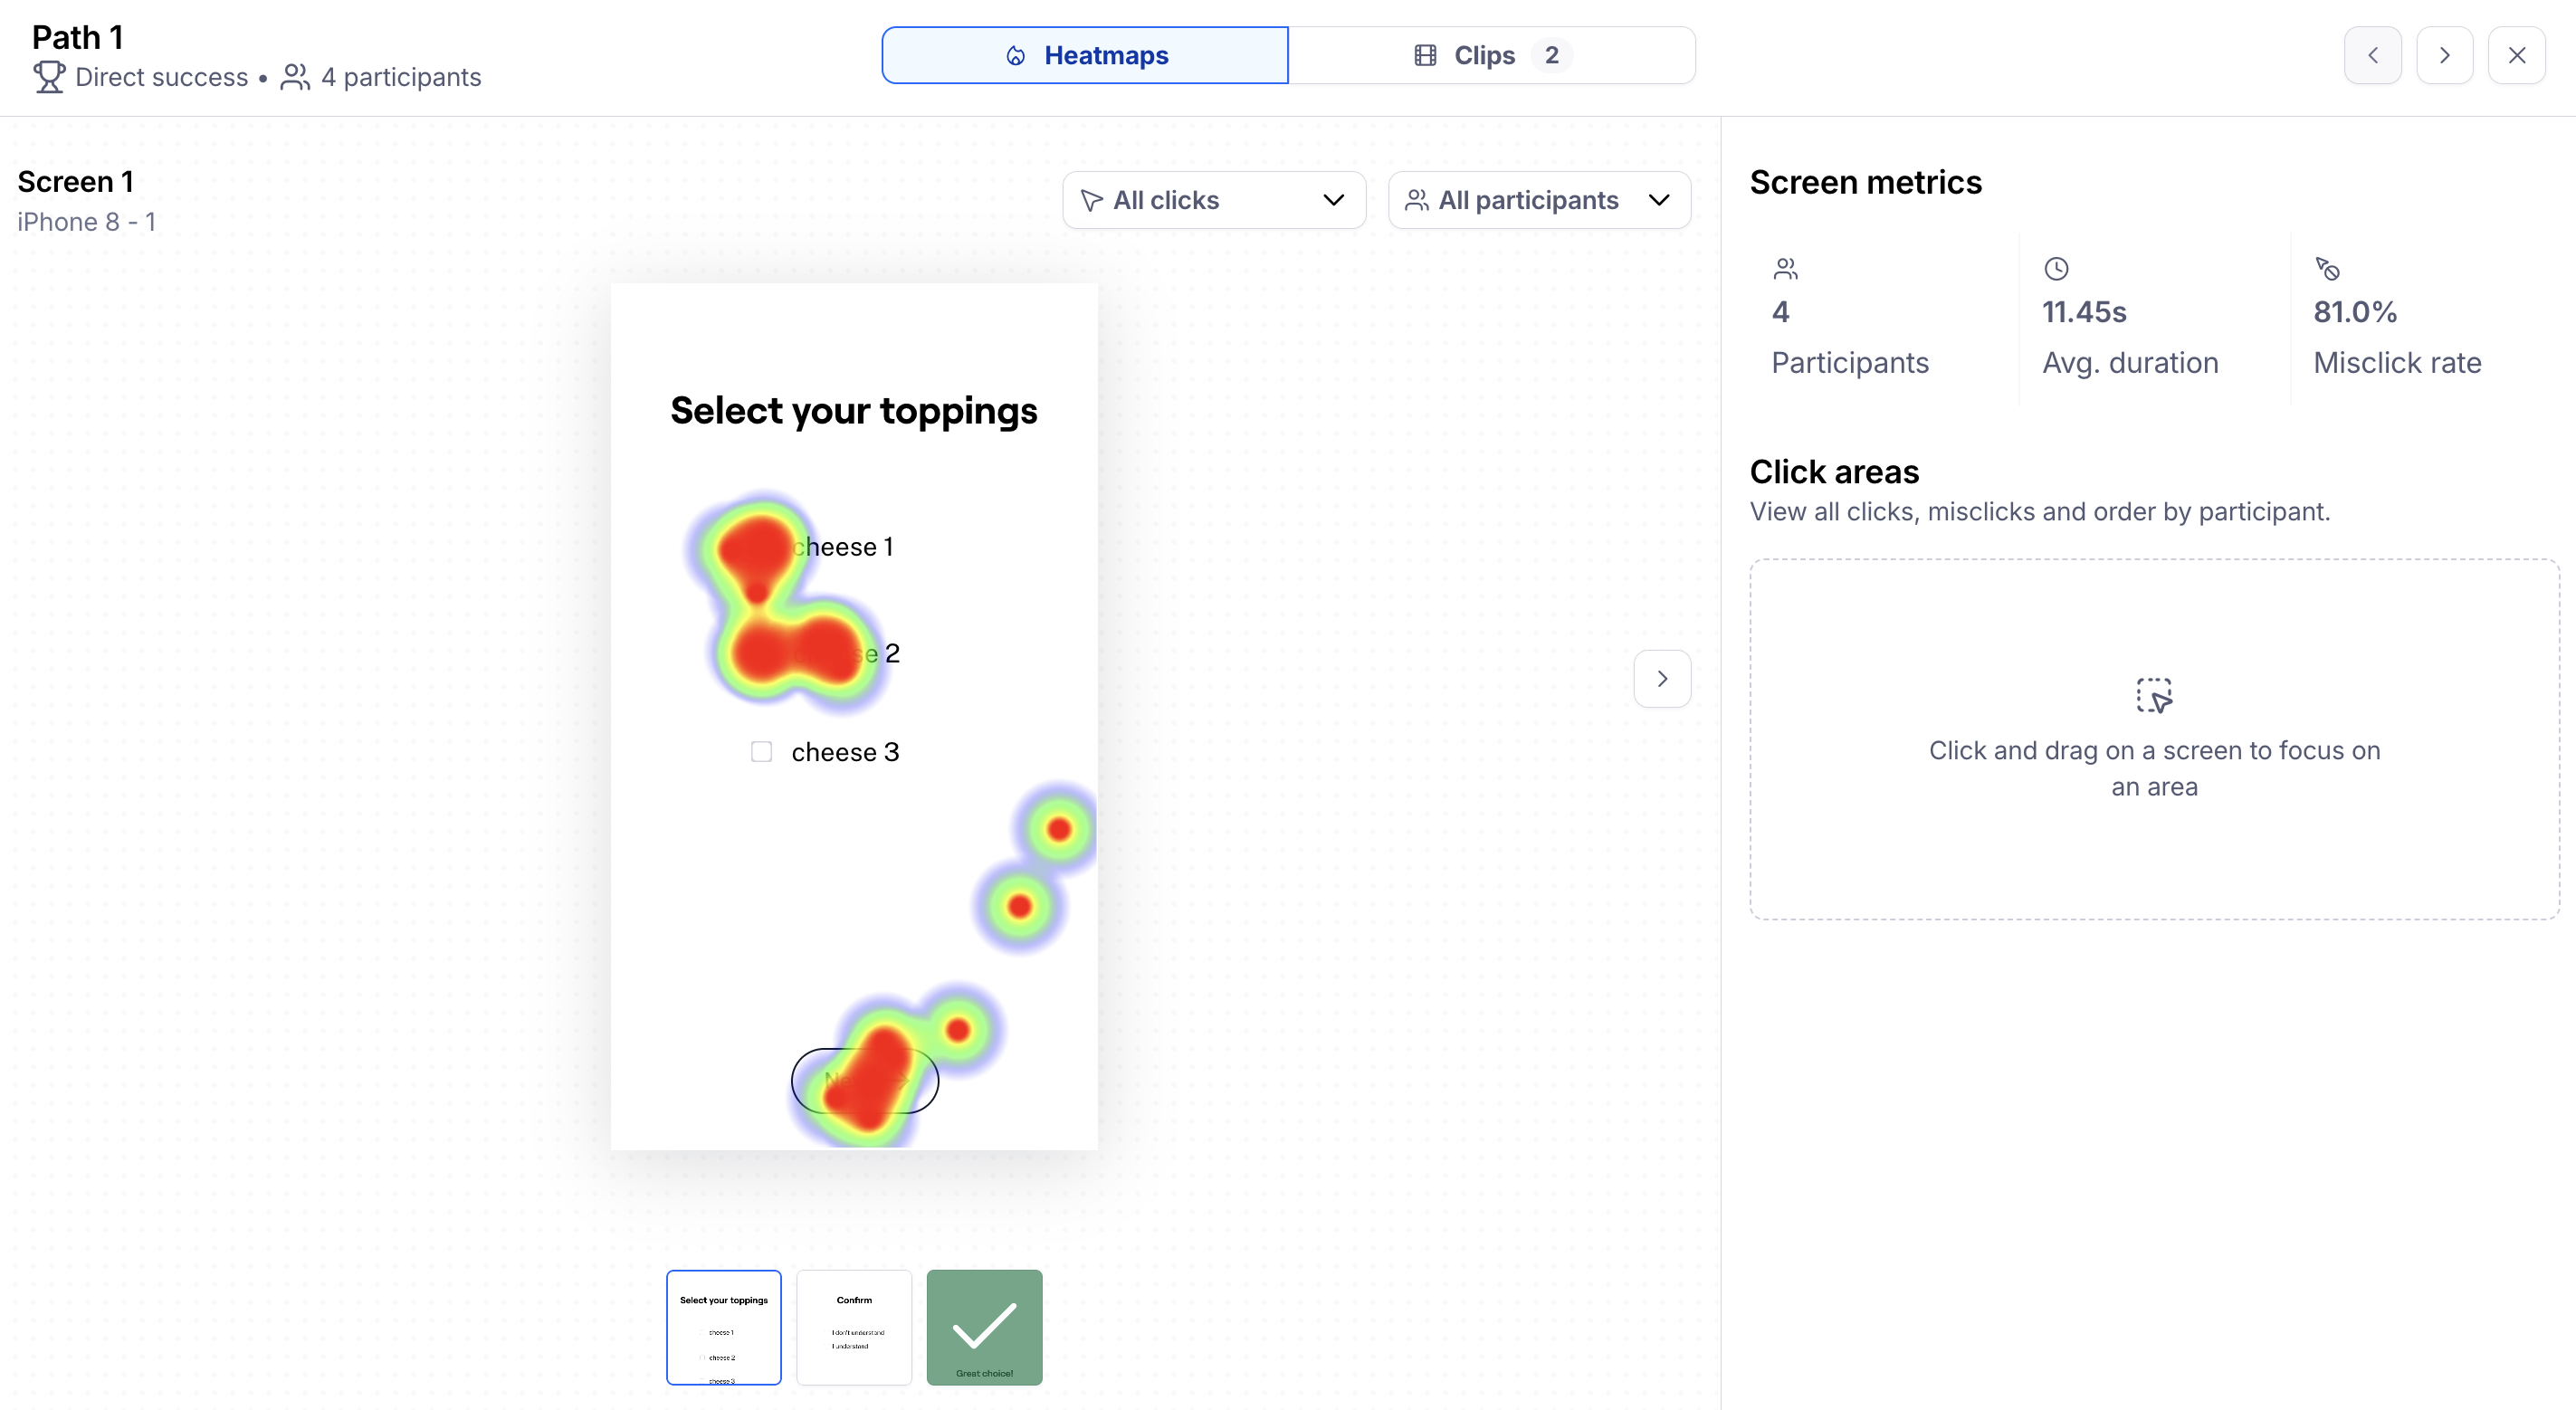
Use your keyboard arrows to quickly navigate through the heatmaps:
- Left (←) and Right (→) to open the previous or next aggregated path
- Up (↑) and Down (↓) to move to the previous or next screen
Screen heatmaps
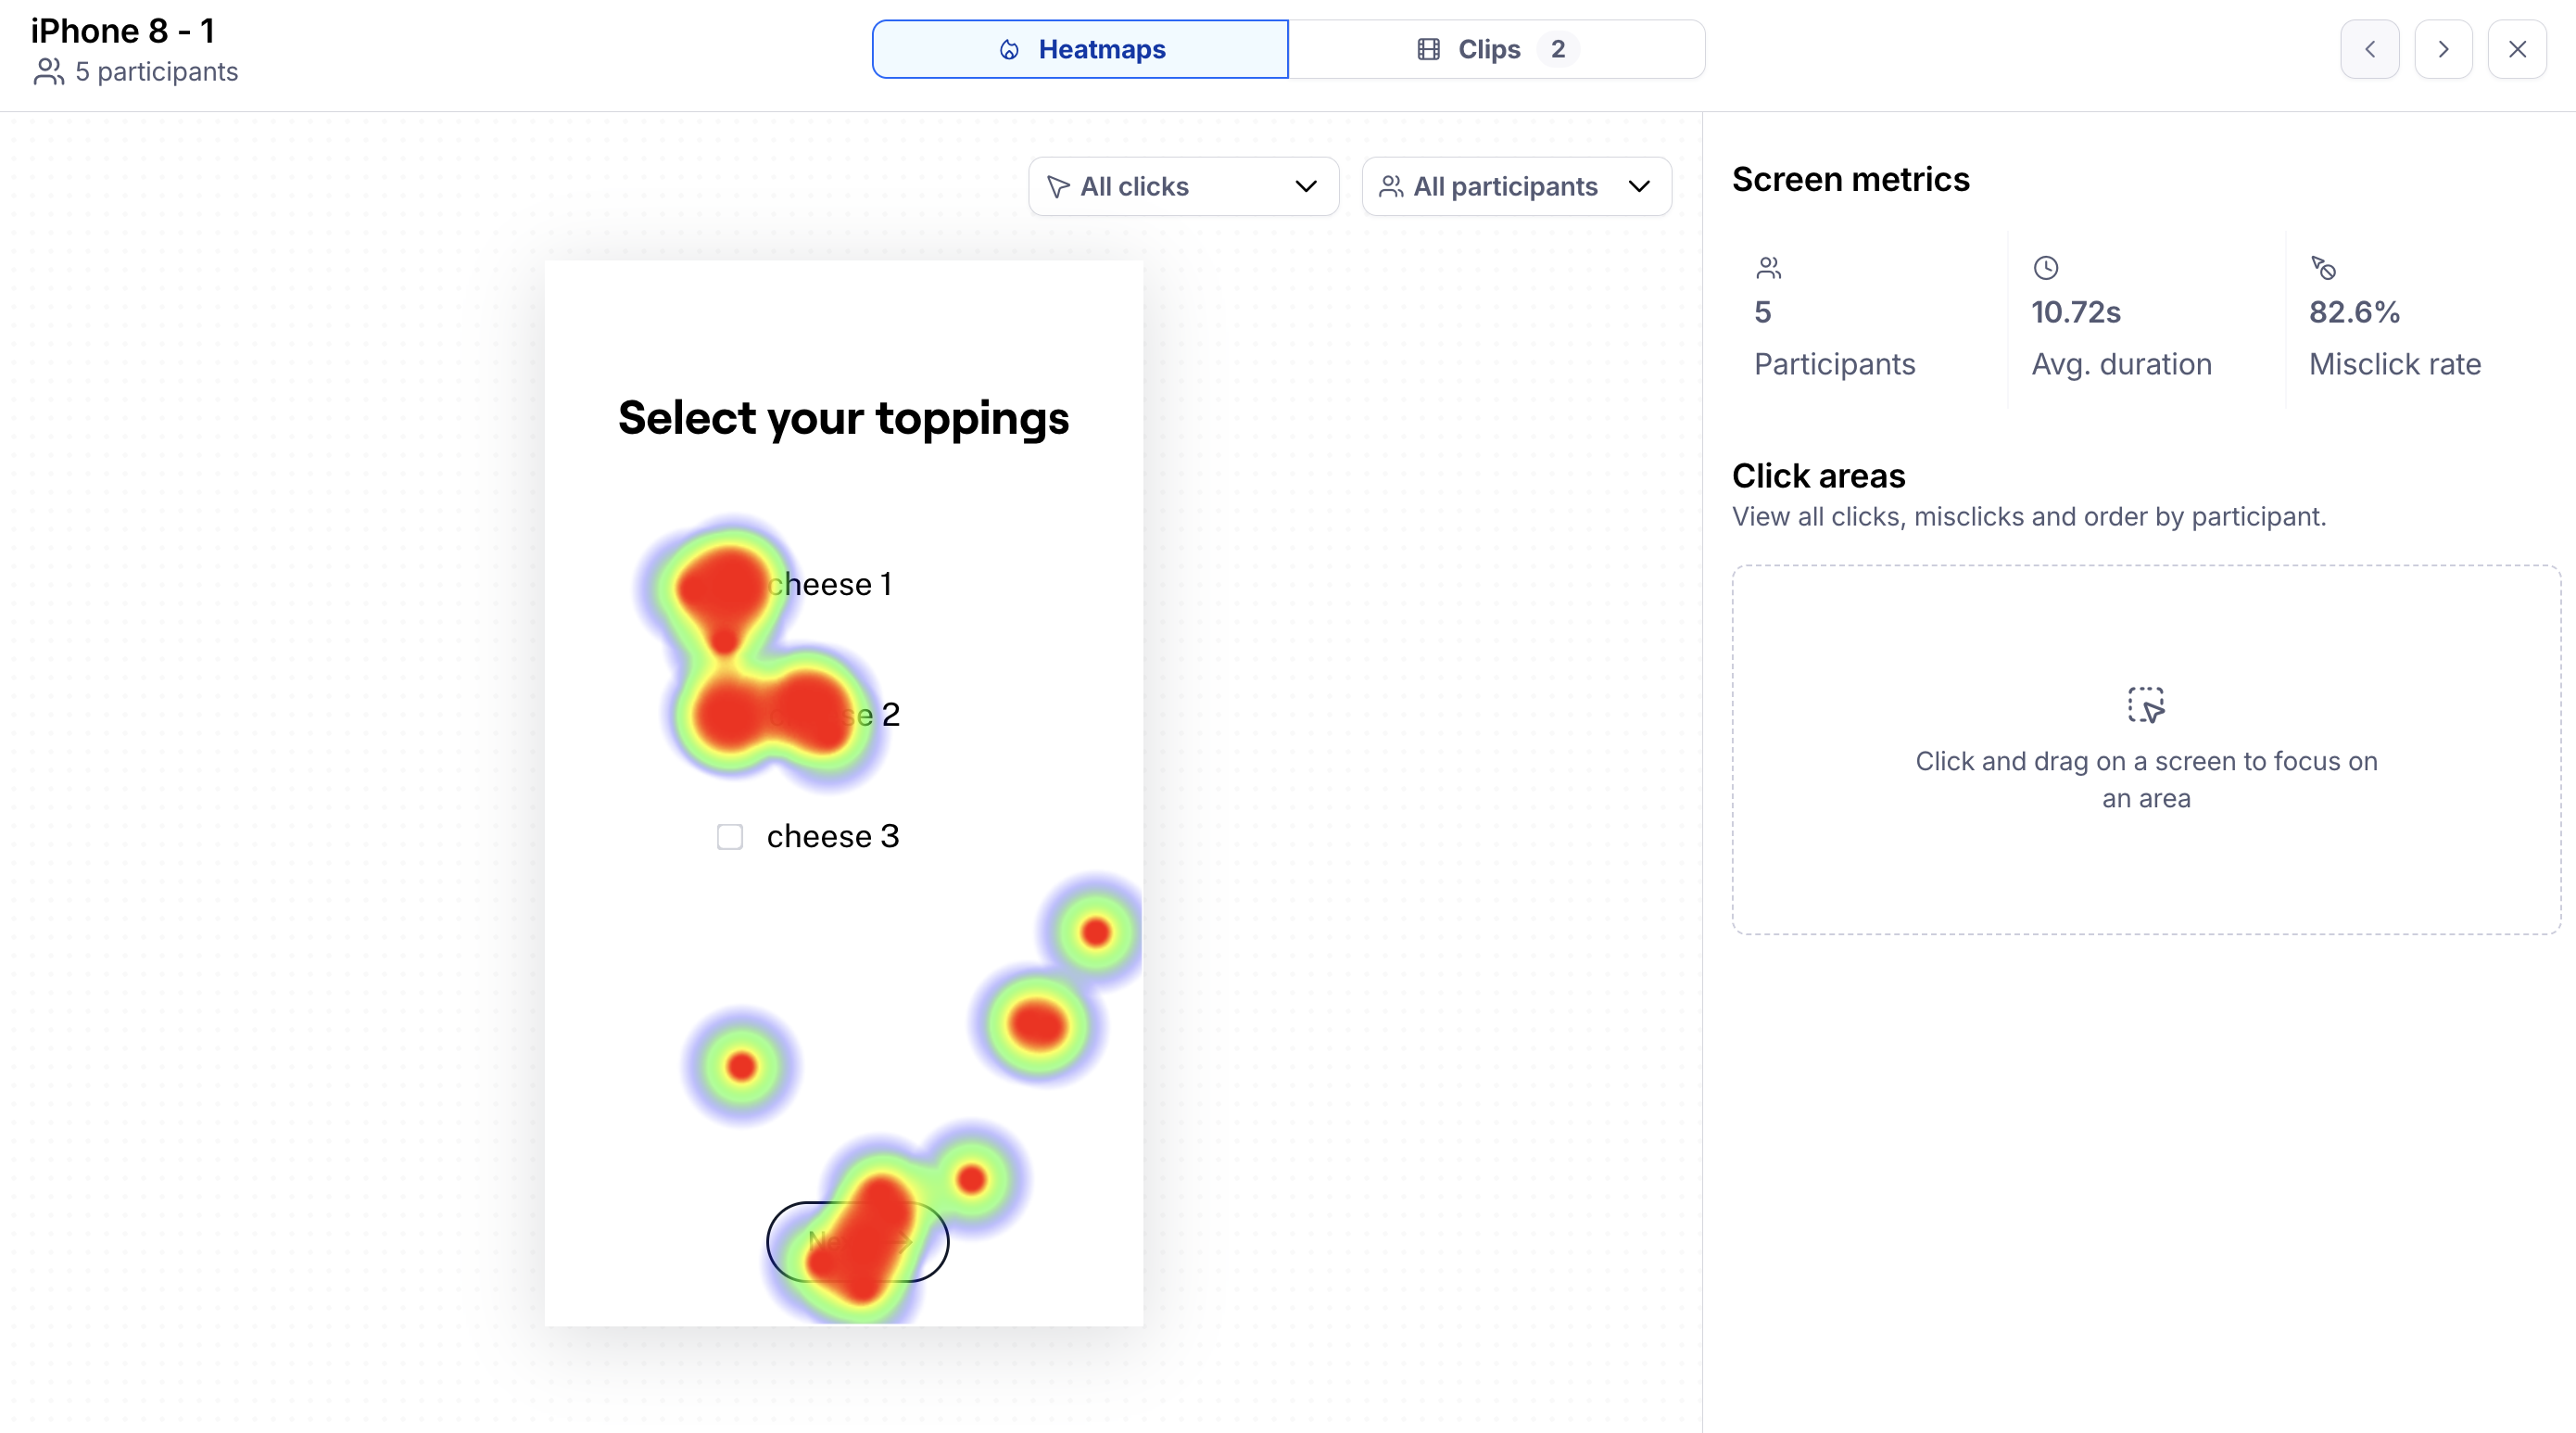
Screen heatmaps display tester clicks based on each screen.
To access the screen heatmaps:
- Open the relevant mission block on your Results dashboard.
-
Under the mission screens section, either search for a specific screen name or click the screen you'd like to view.
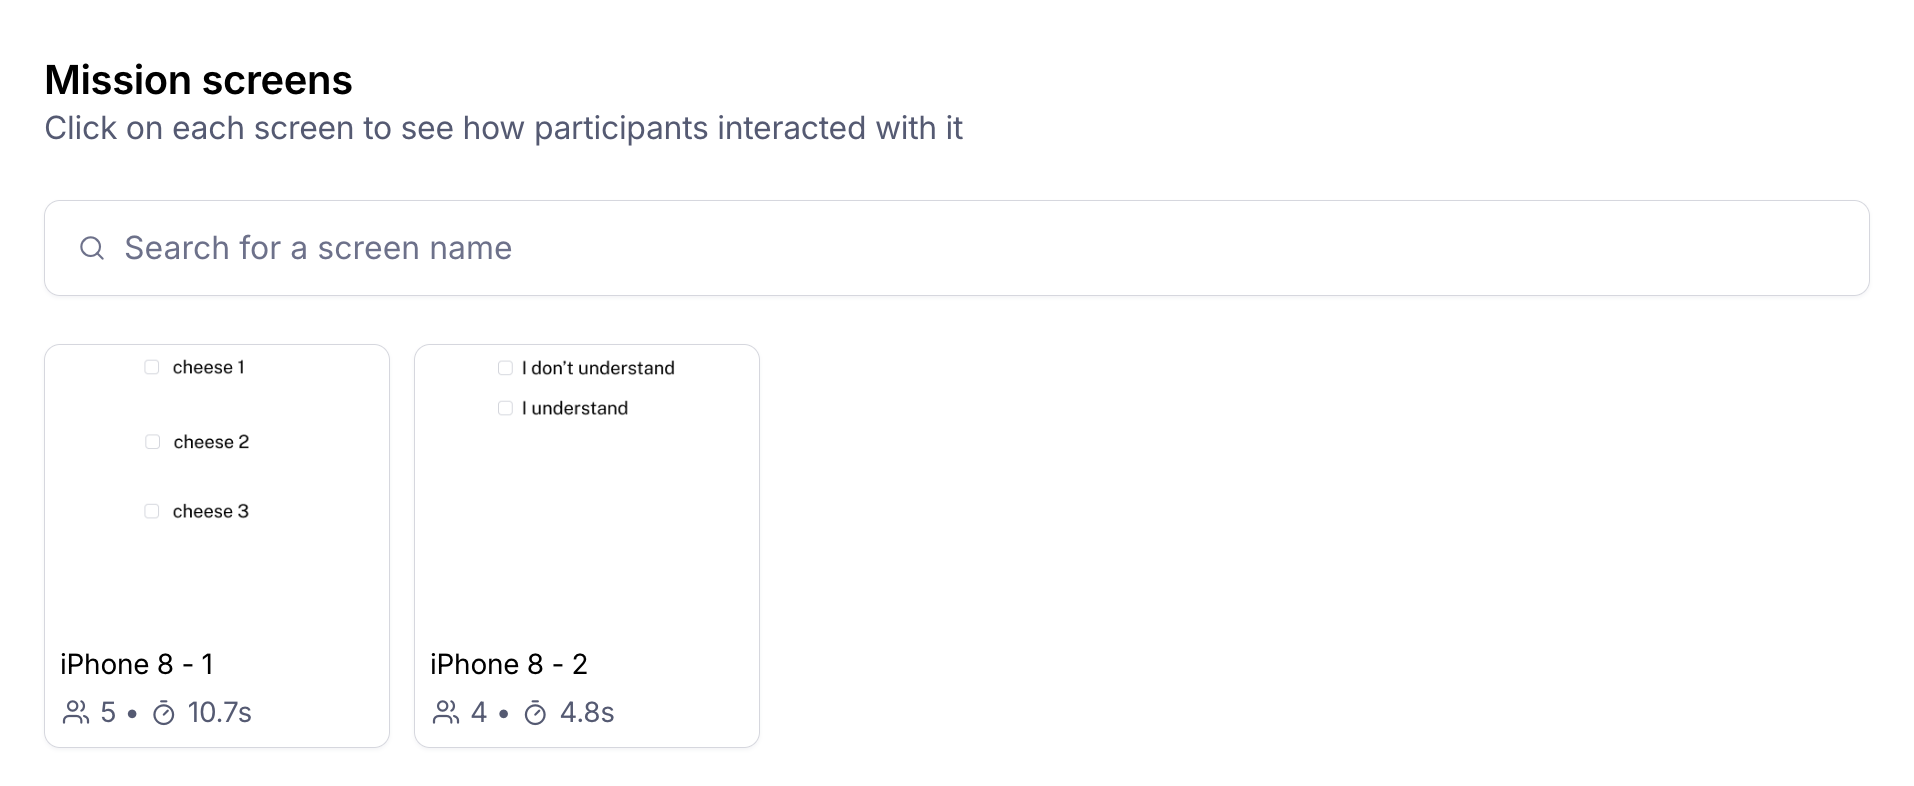
- The heatmap for that screen will be displayed.
Screen metrics
To the right side of the heatmap, you'll see a summary of usability metrics for that screen:
- Participants: Number of participants who interacted with that particular screen in that context (e.g. within a specific path, or with a specific filter applied)
- Misclick rate: The screen misclick rate is the percentage of clicks in a non-clickable area (i.e. outside a hotspot) in that particular screen. In a live product, a misclick would have taken the user to an “incorrect” page.
- Avg. duration: The average time participants spent on that particular screen. Too much time spent on a screen may indicate that something needs to be improved.
Click areas
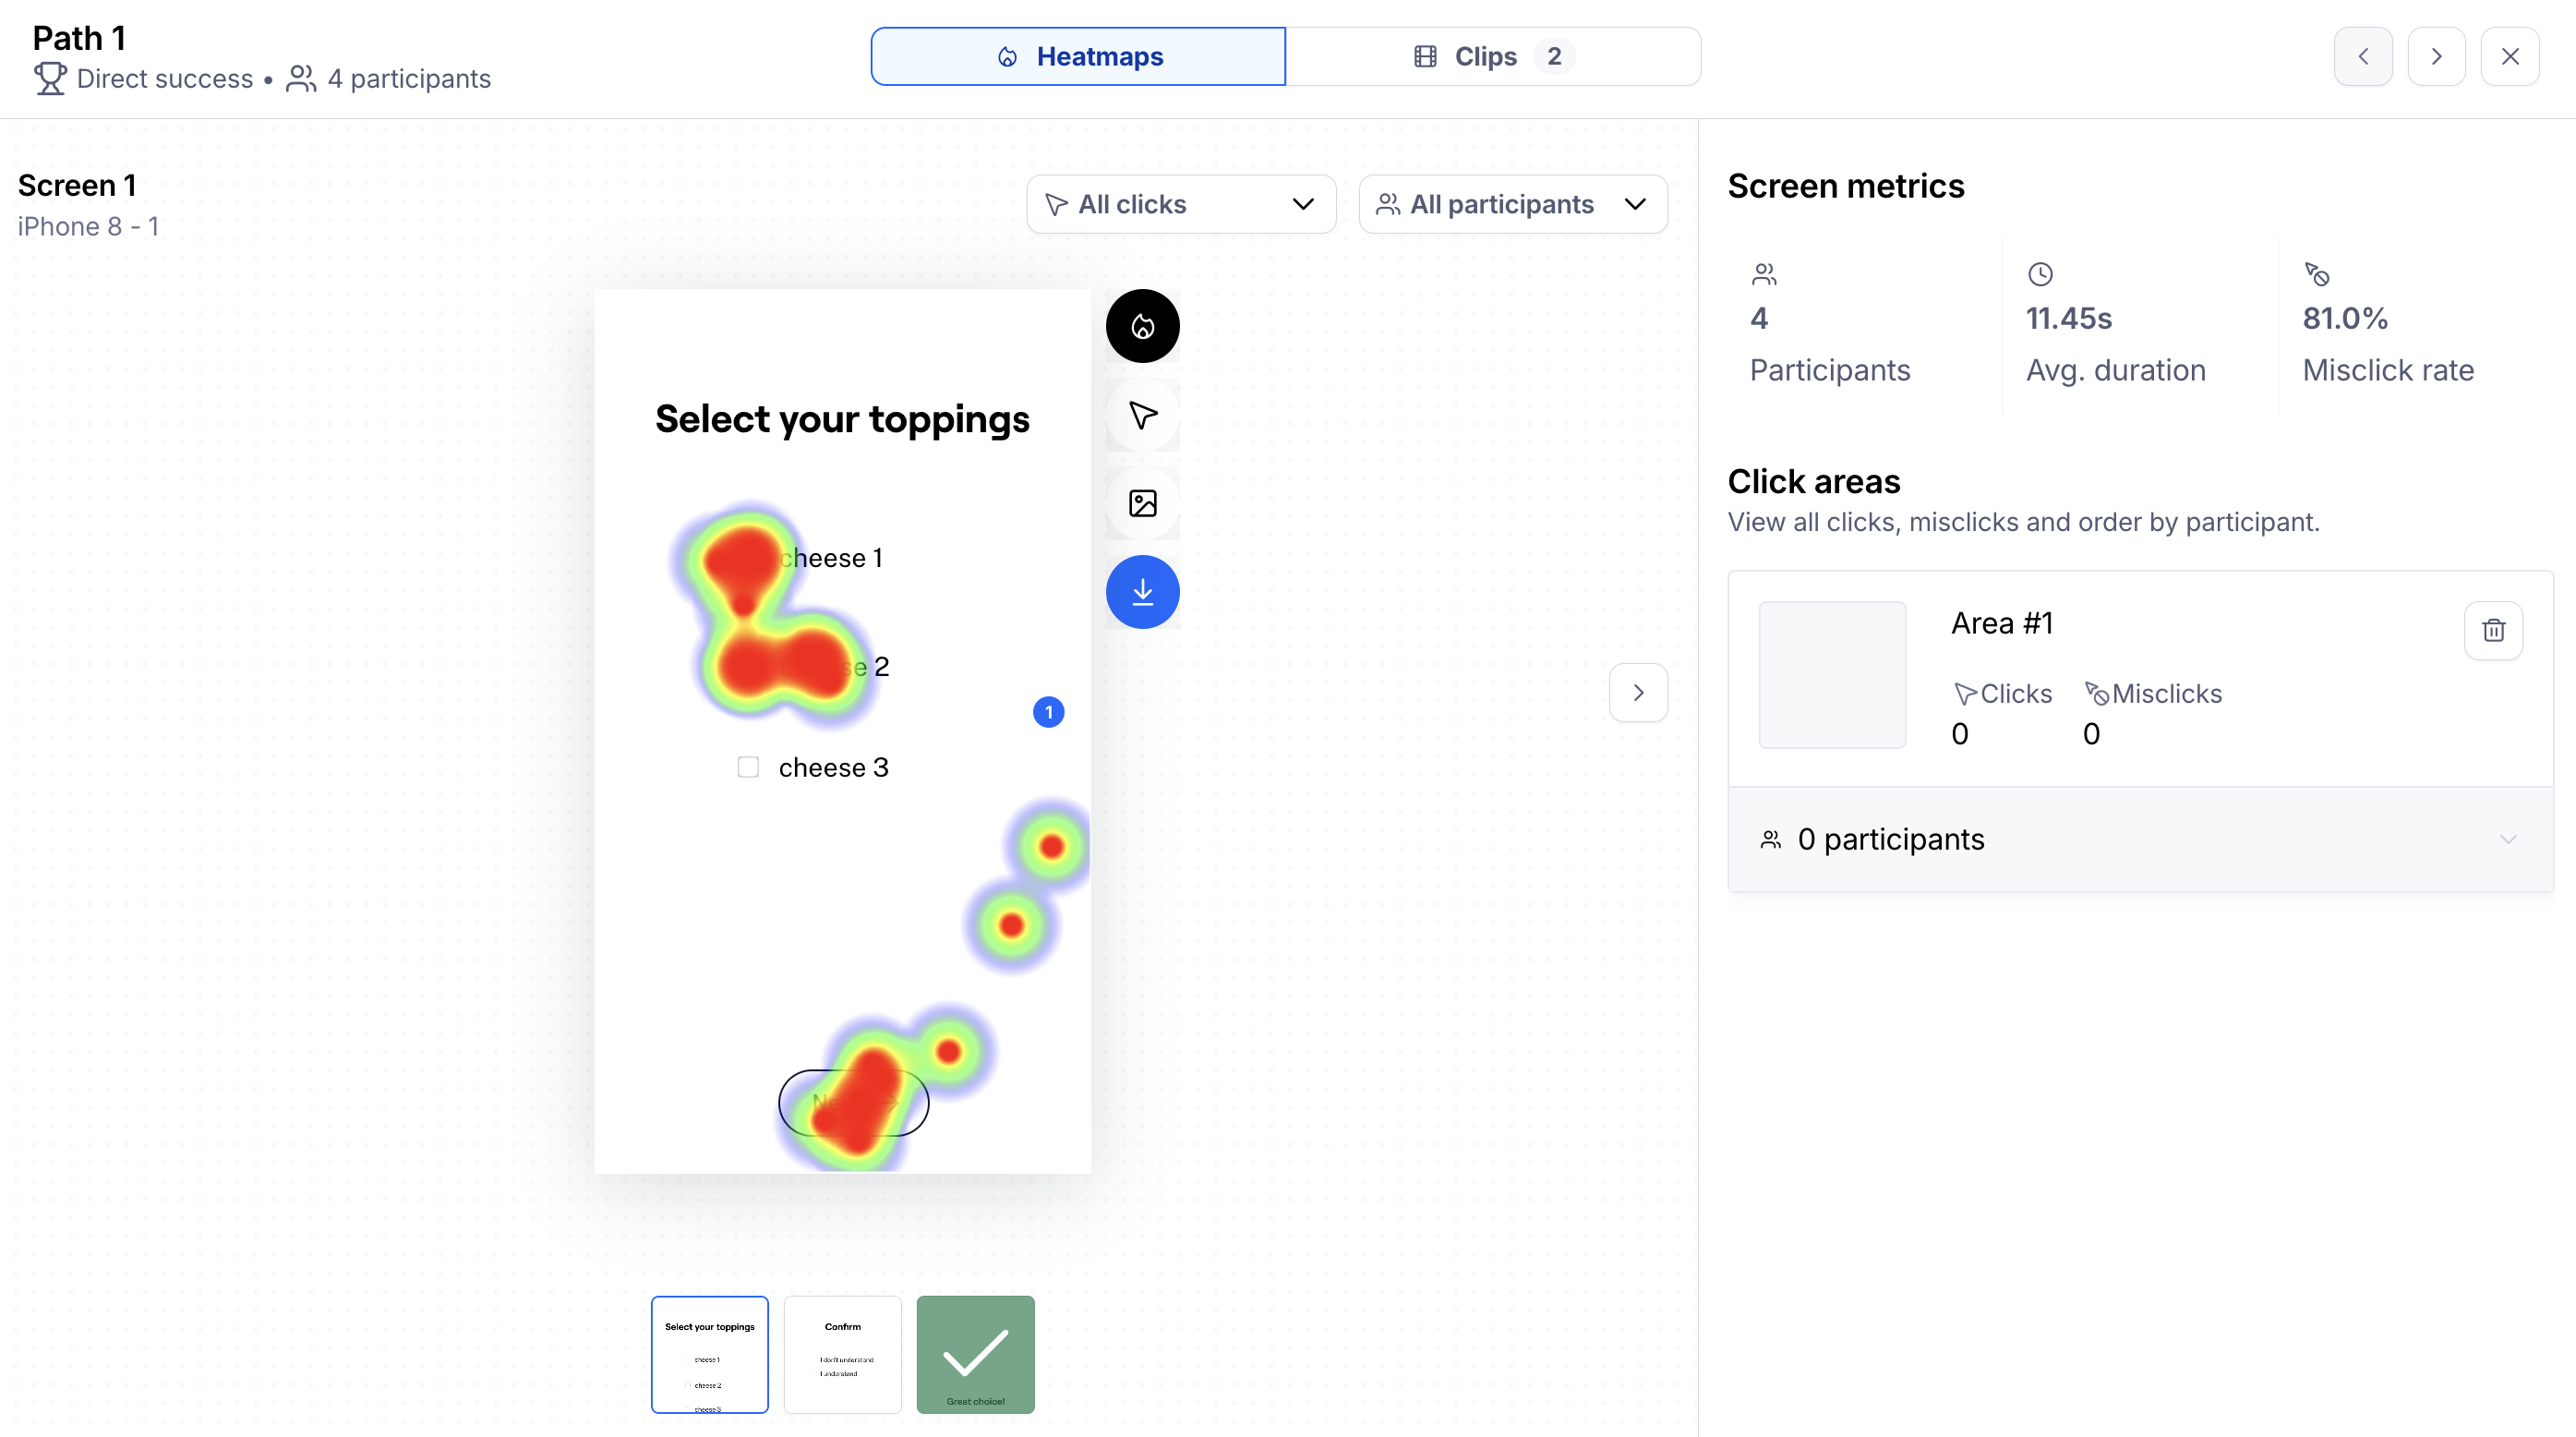
Use Click areas to show screen metrics for specific areas on your heatmap.
To create a Click area, click and drag on the screen. You may create as many areas as you need. The areas you create will appear on the right side of the screen.
Individual participant heatmaps
Participant heatmaps display clicks for each participant who completed your mission.
To access the participant heatmaps:
- Open the relevant mission block on your Results dashboard.
-
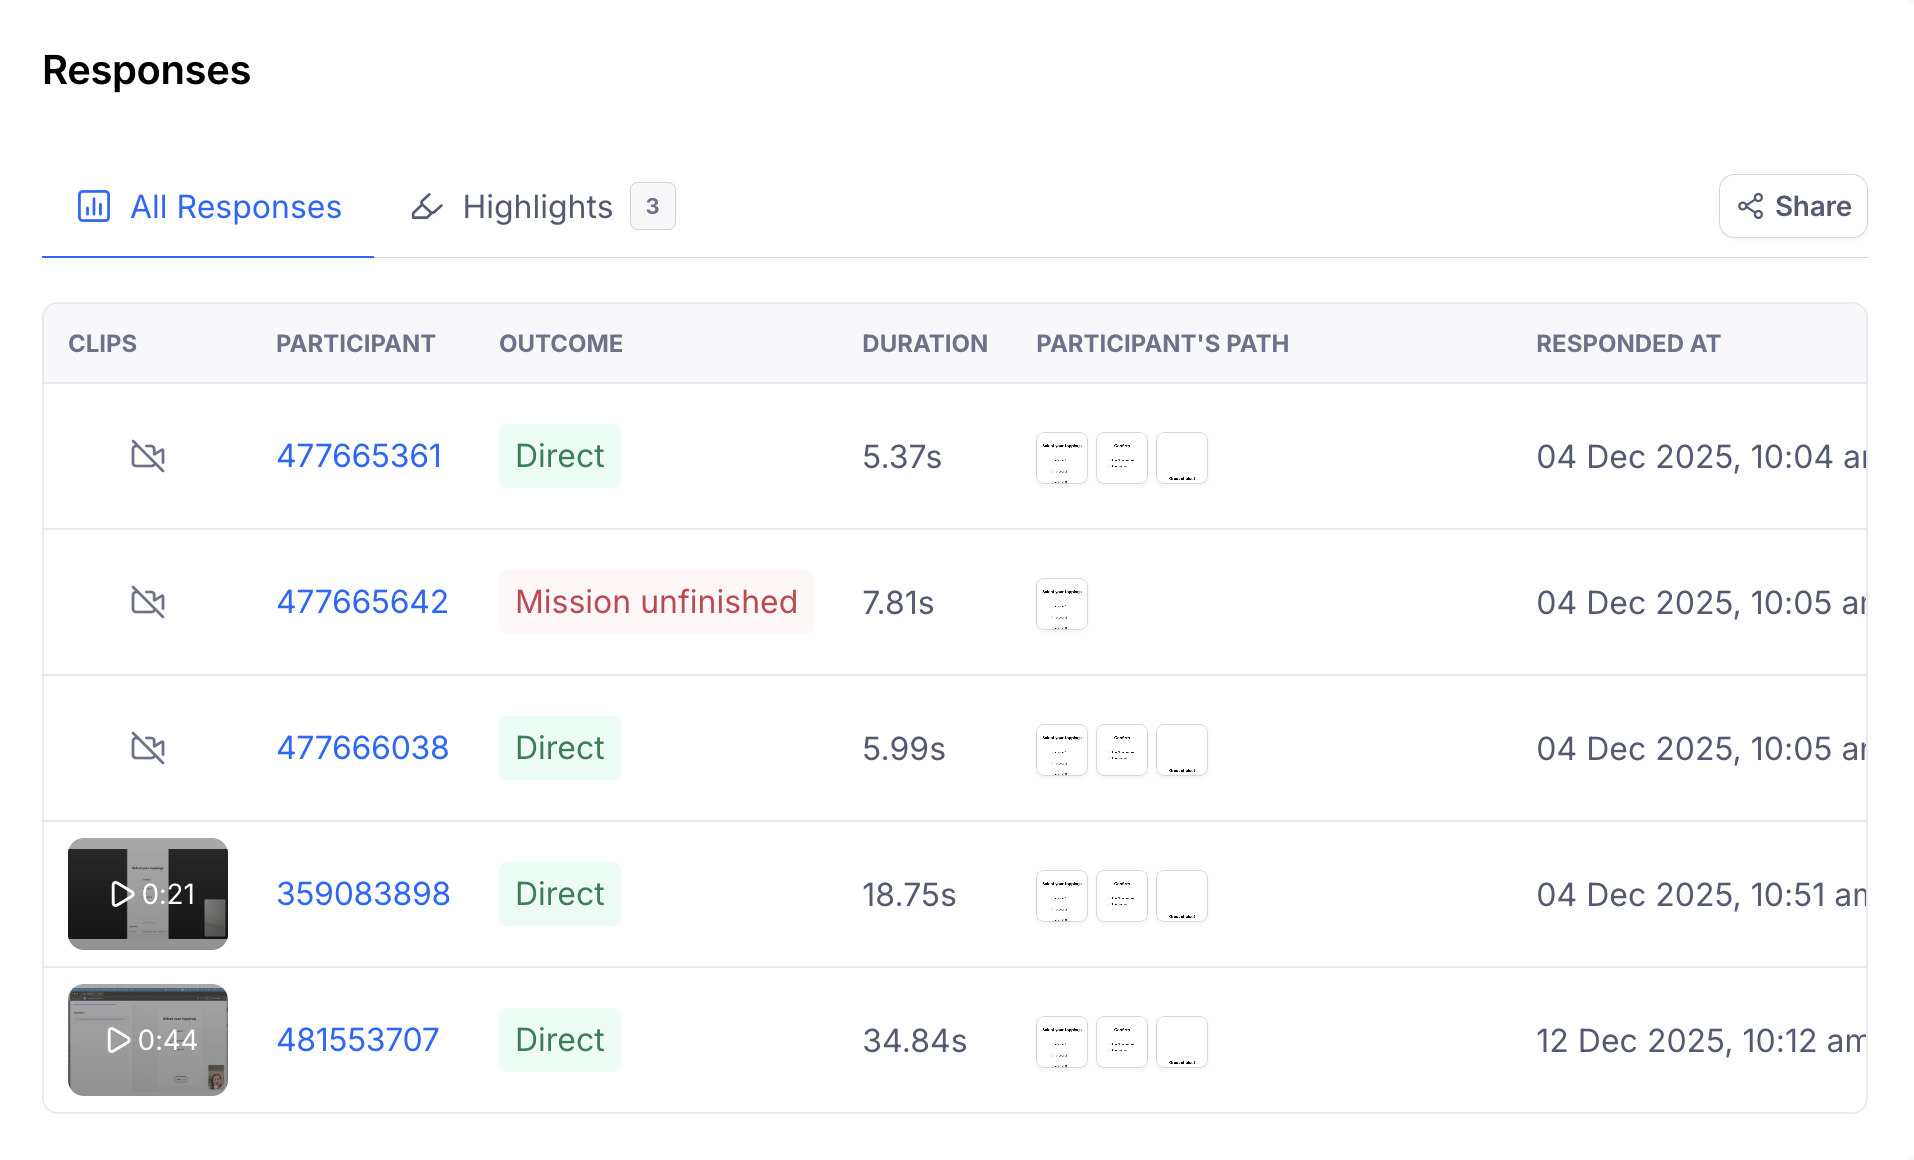
Scroll down to the Responses section.
-
Click one of the participant rows and in the prototype test section in the side panel pop up, click View path heatmaps.
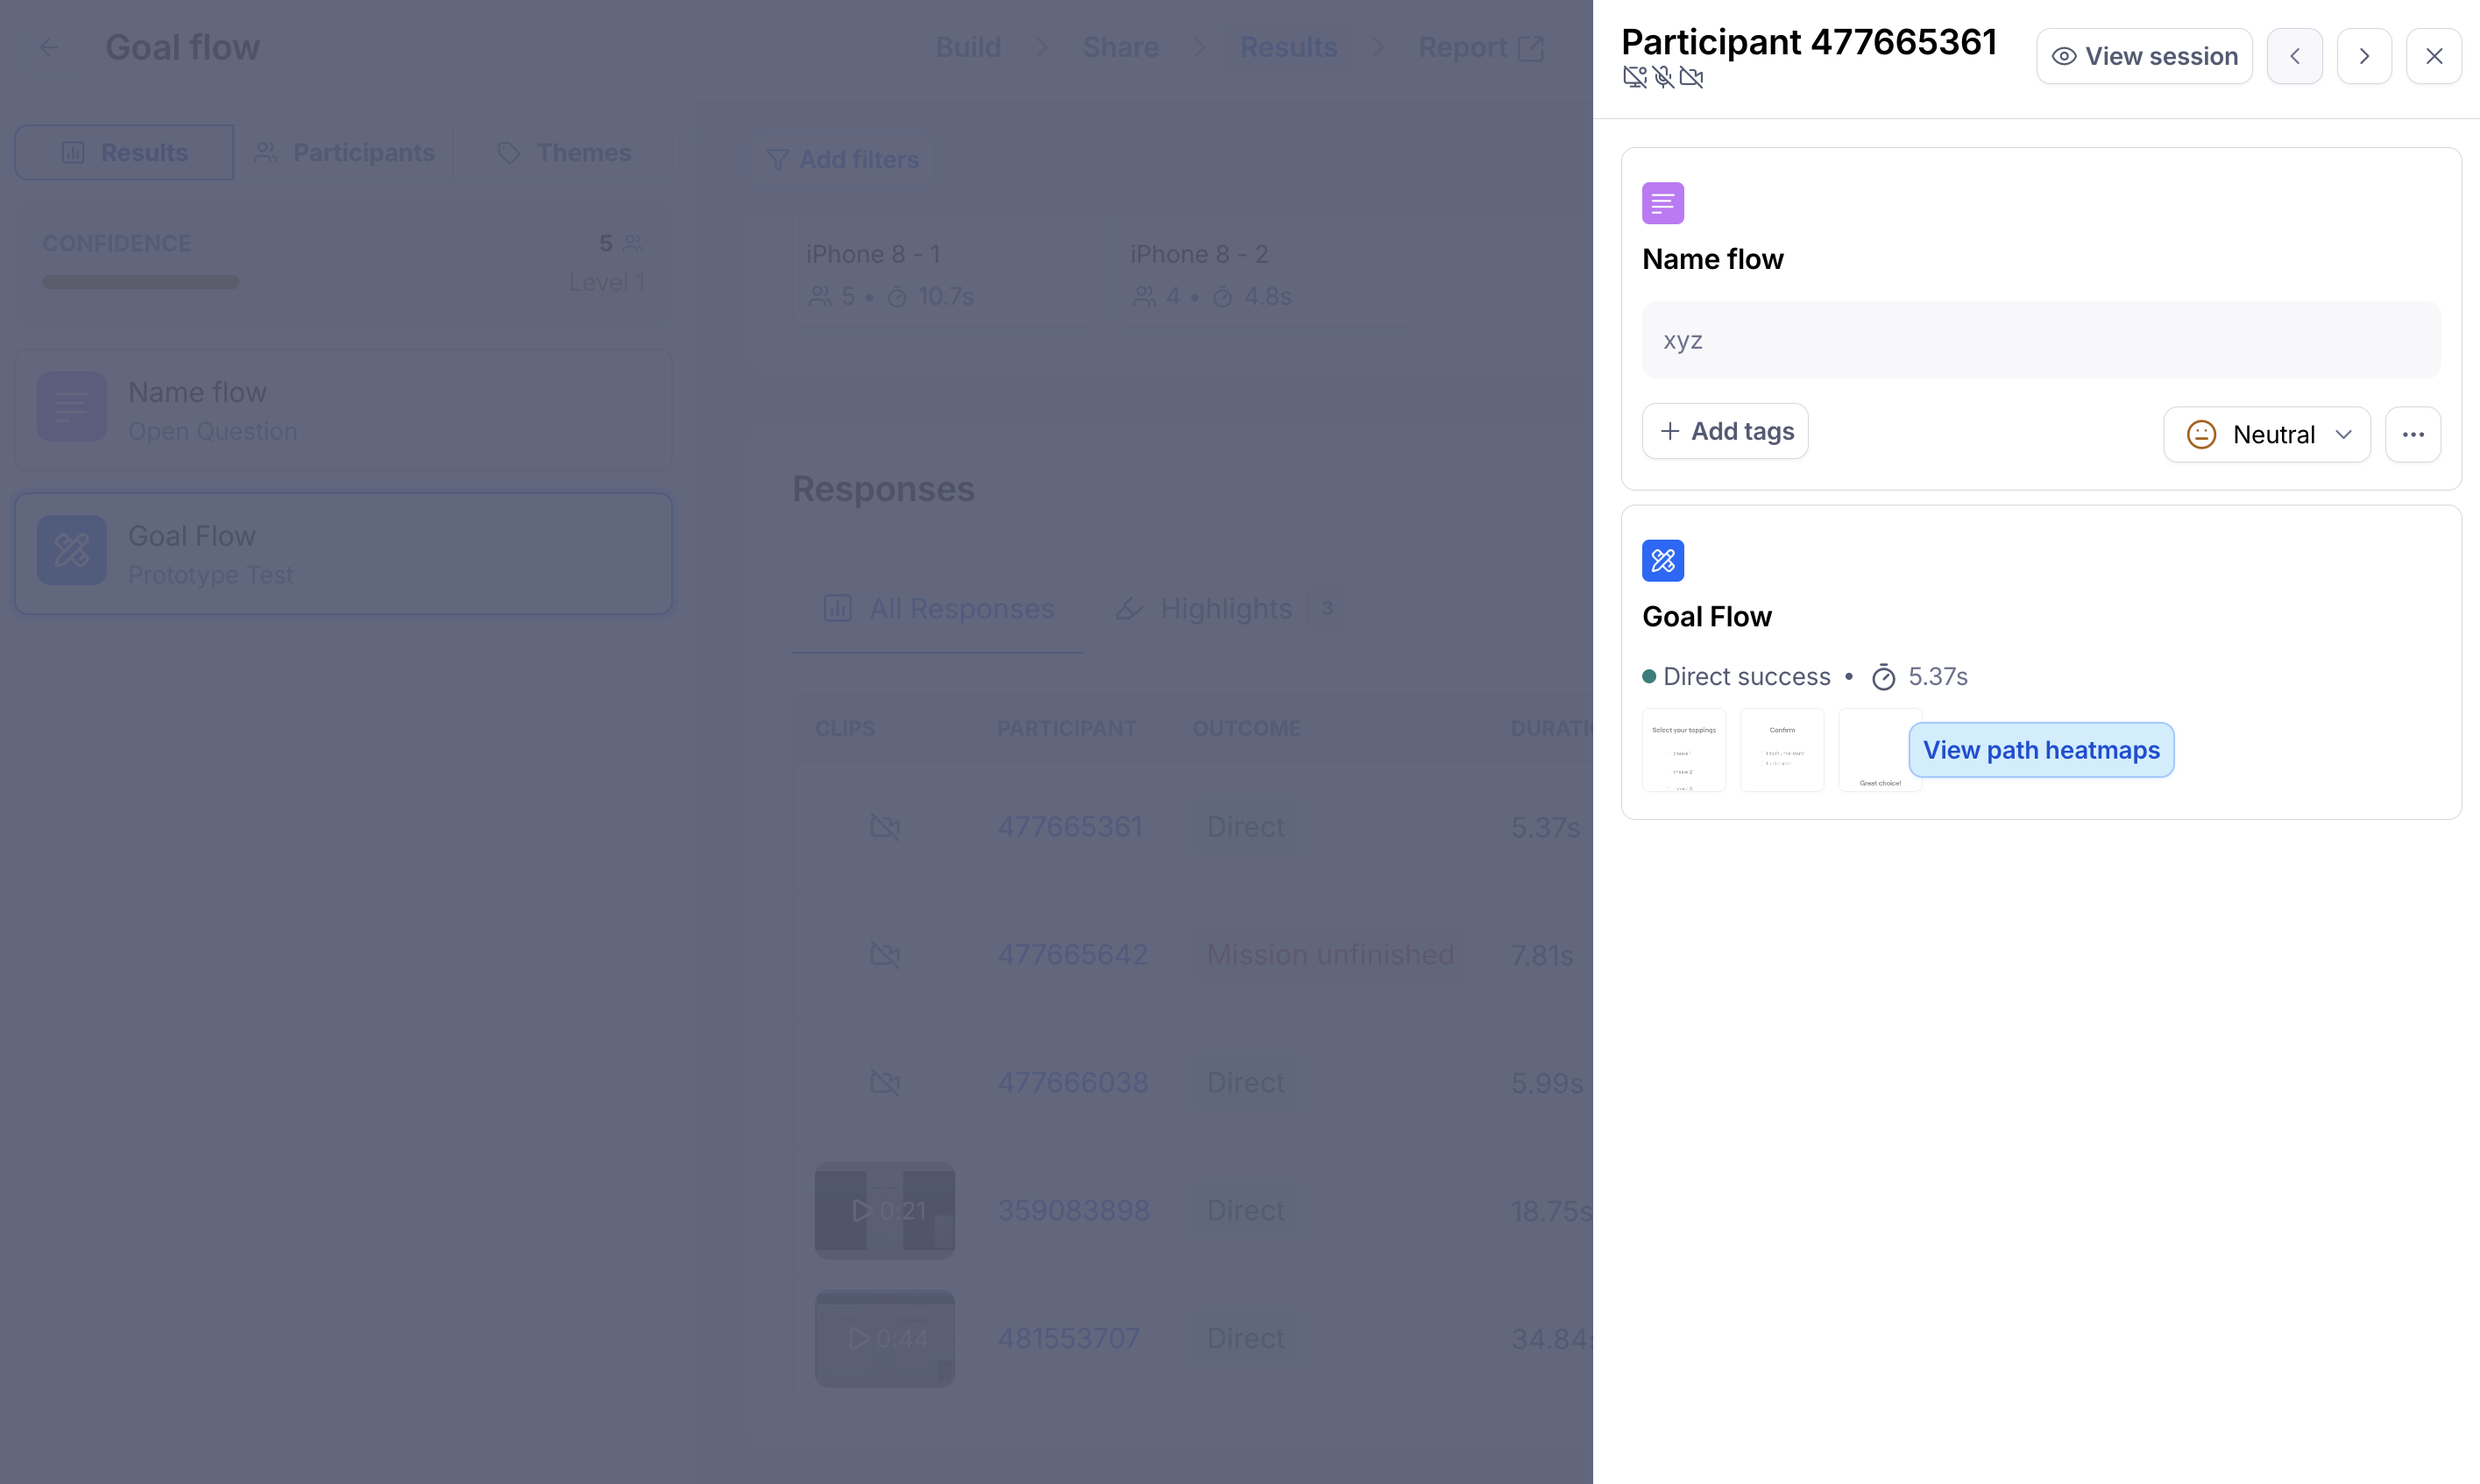
- The heatmaps for each screen for that individual tester will be displayed.
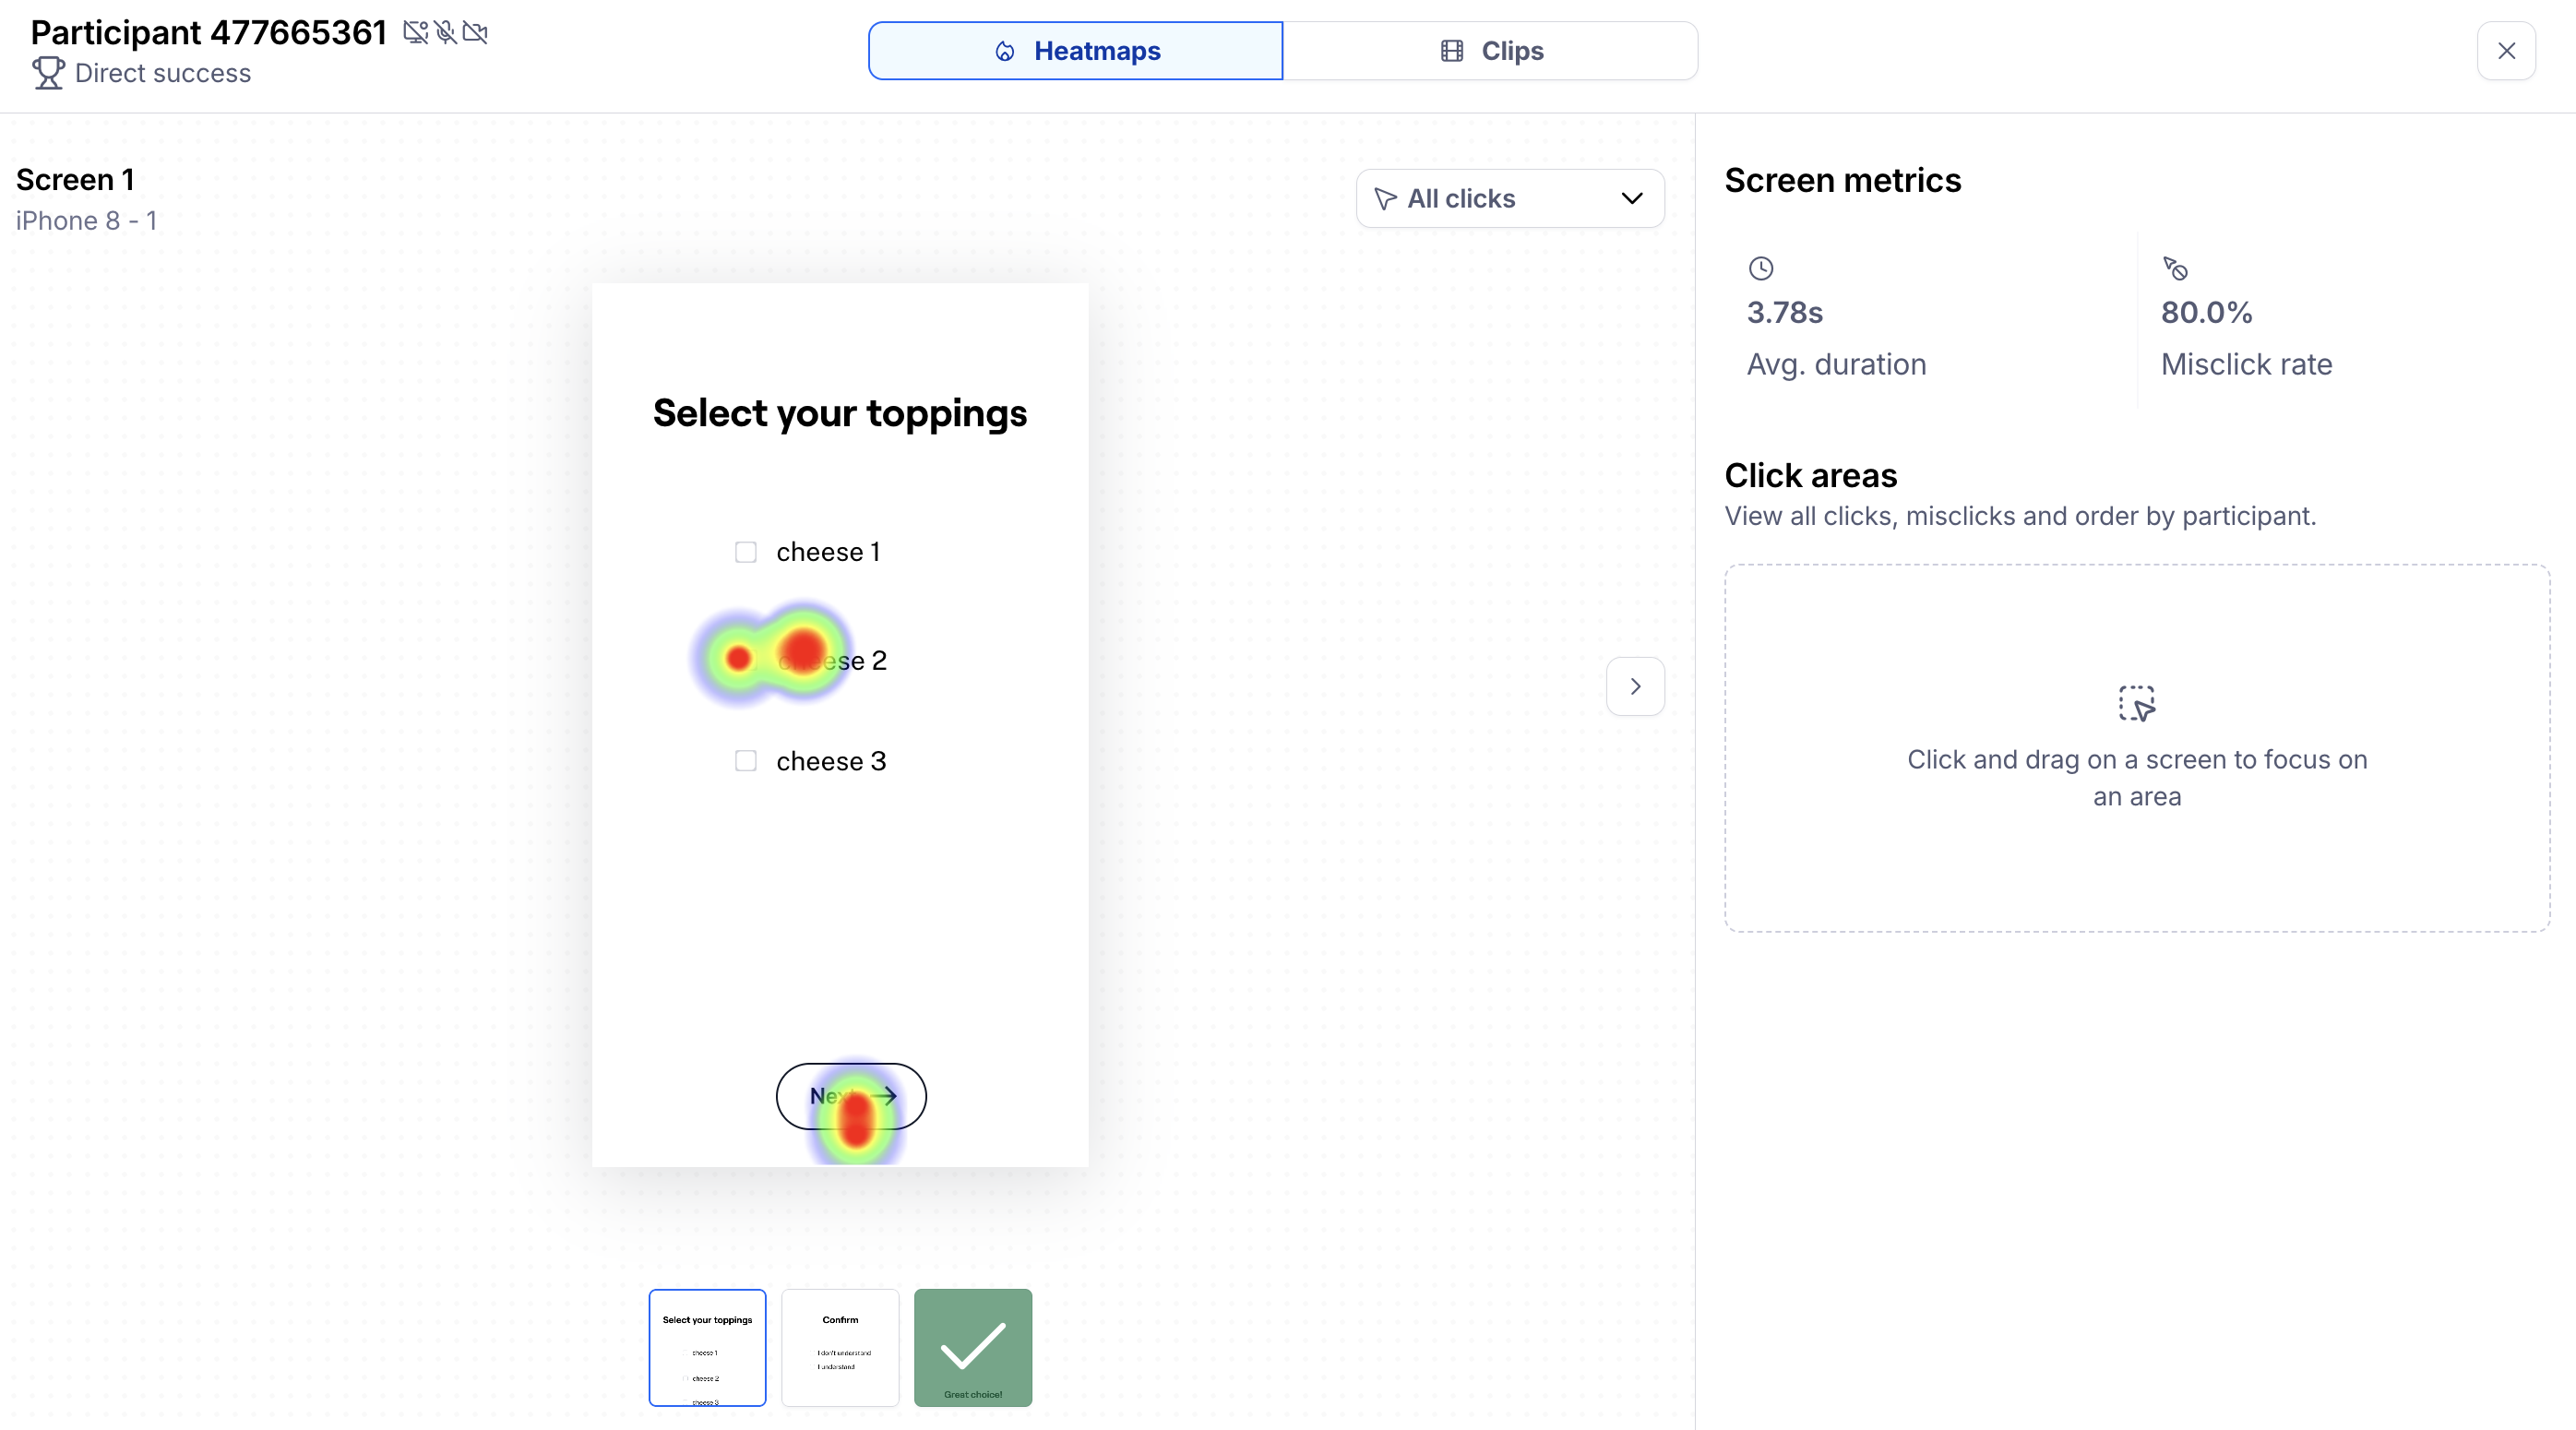
Use your keyboard's Left (←) and Right (→) arrows to quickly navigate to the previous or next screen.
Filter the information on your heatmaps
Filter clicks
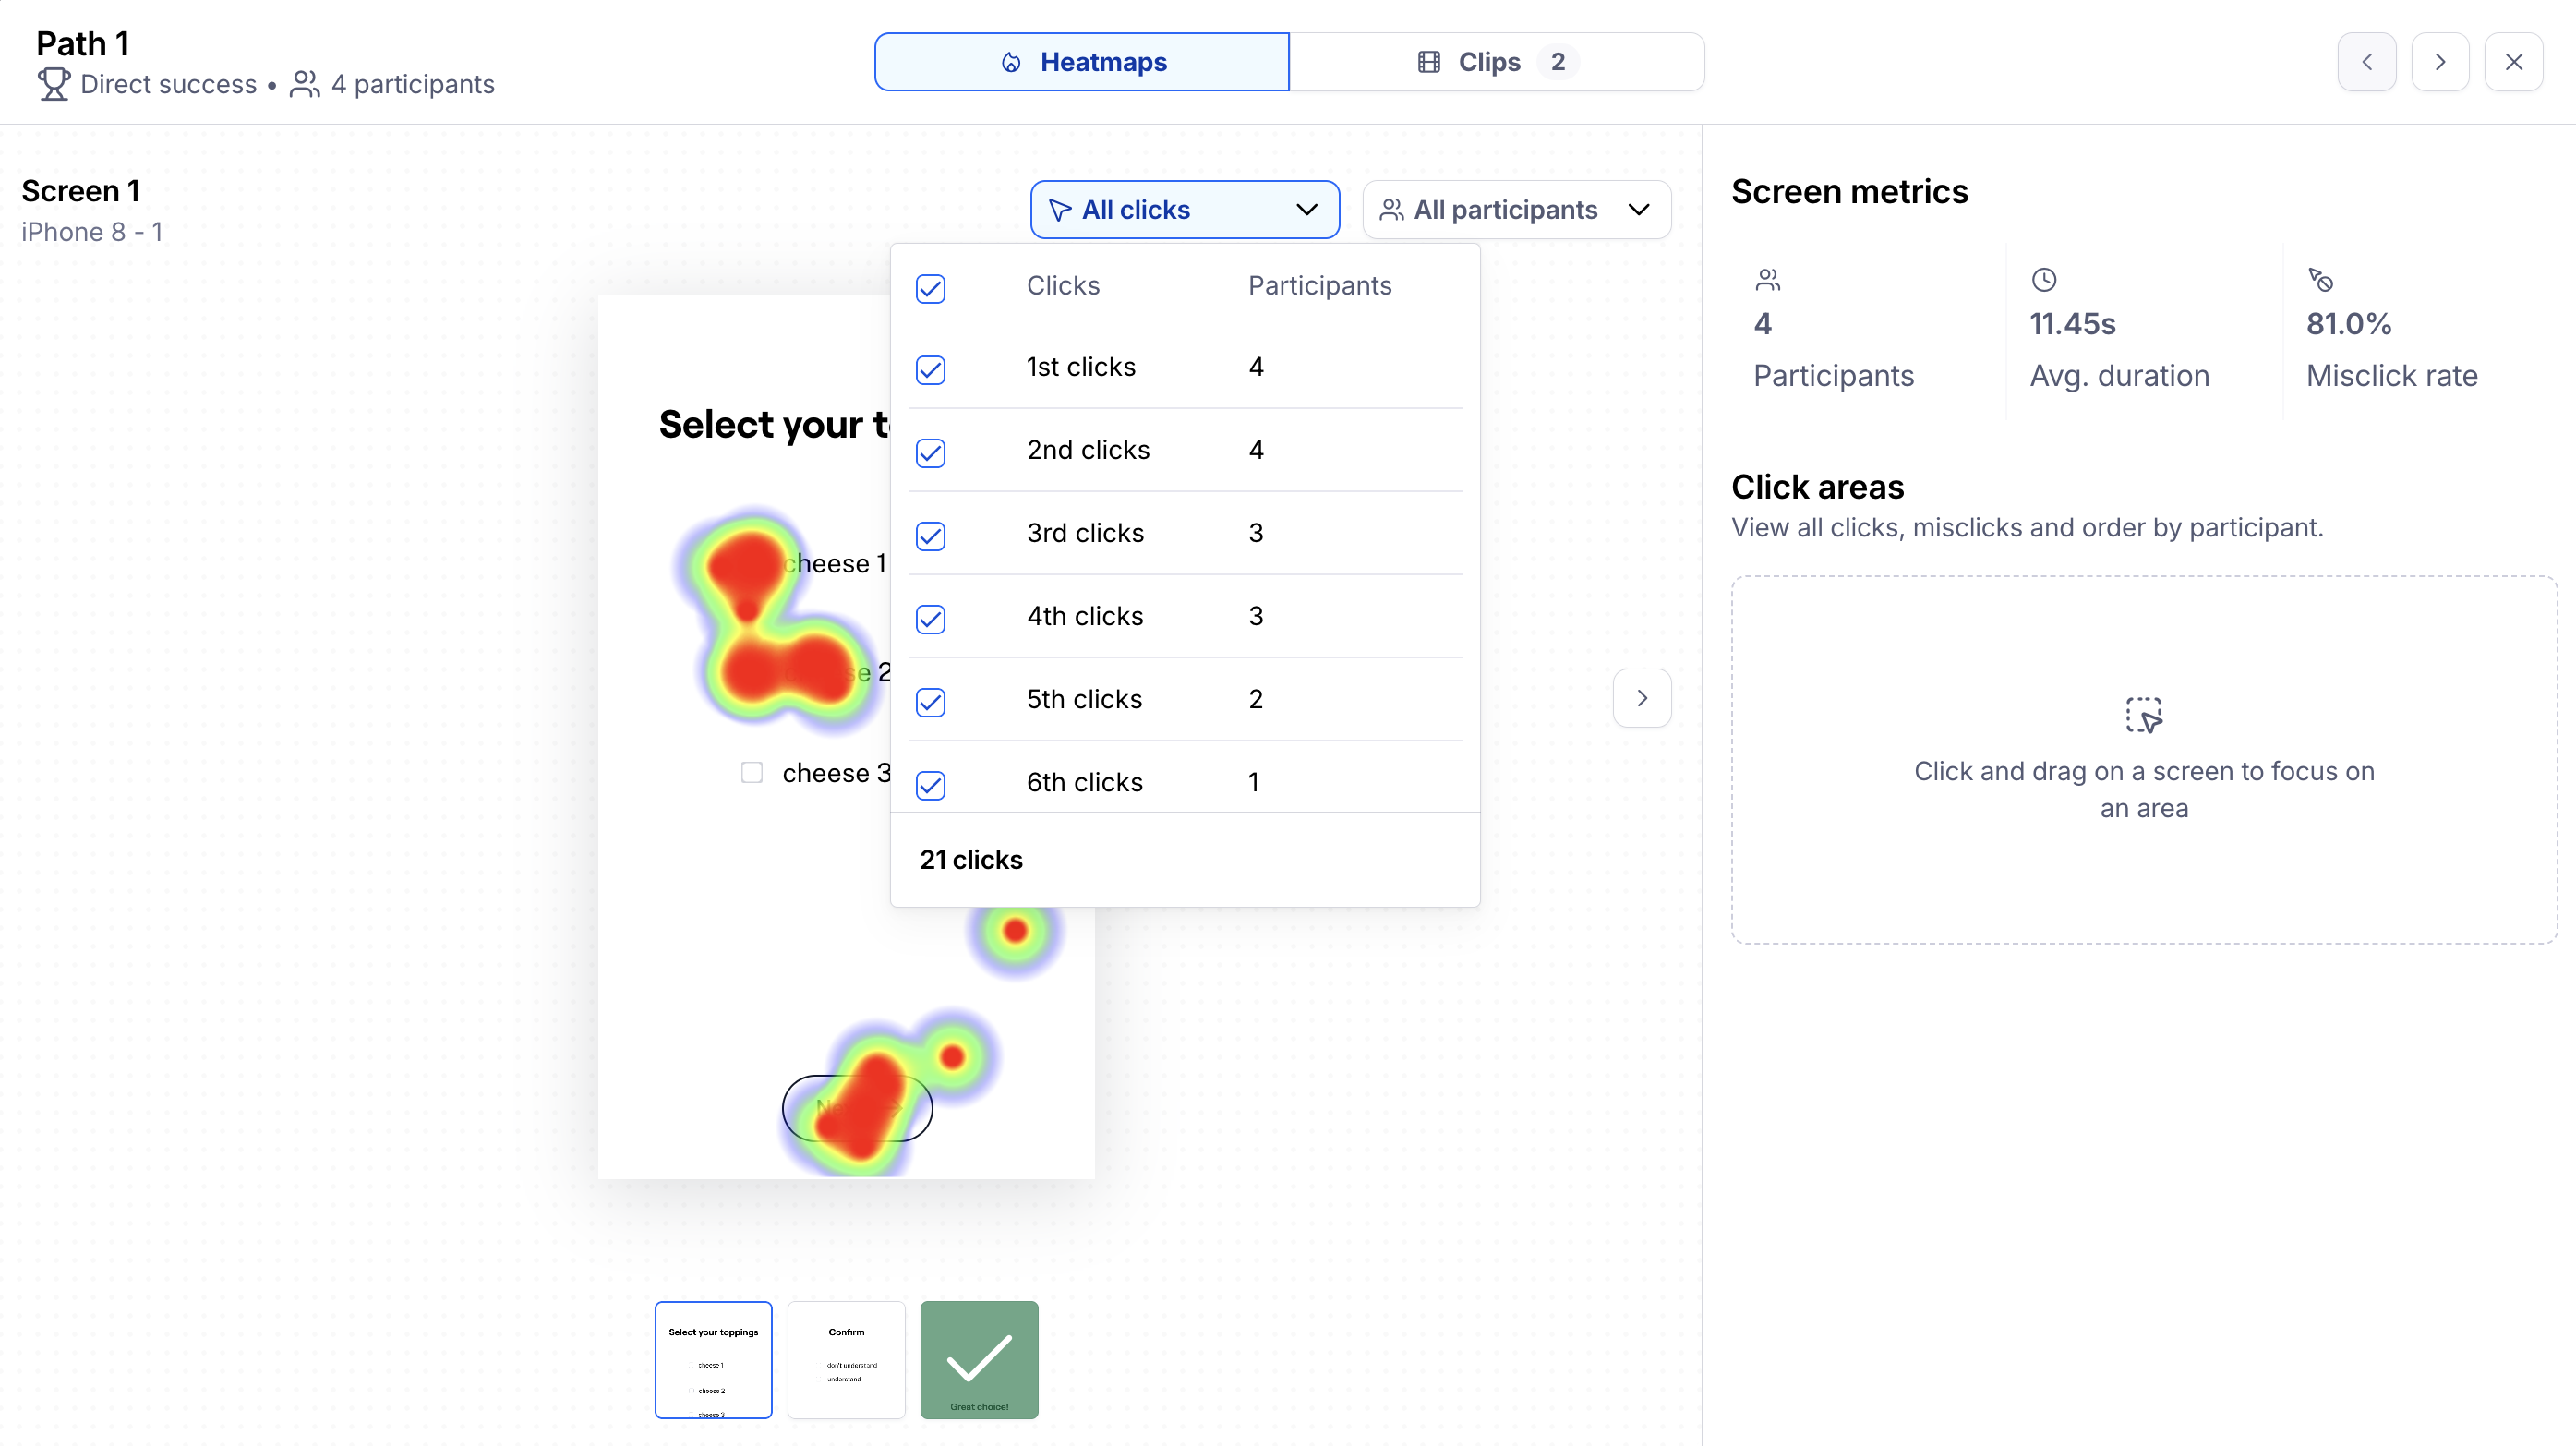
Using the top navigation bar, you can narrow down the clicks that are displayed on a heatmap.
Click the drop-down to toggle between all clicks or selected clicks. This allows you to see clicks in the order they were performed by testers, and how many testers performed each click type.
For instance, you can use this option to identify where your testers clicked first on a particular screen.
Filter testers
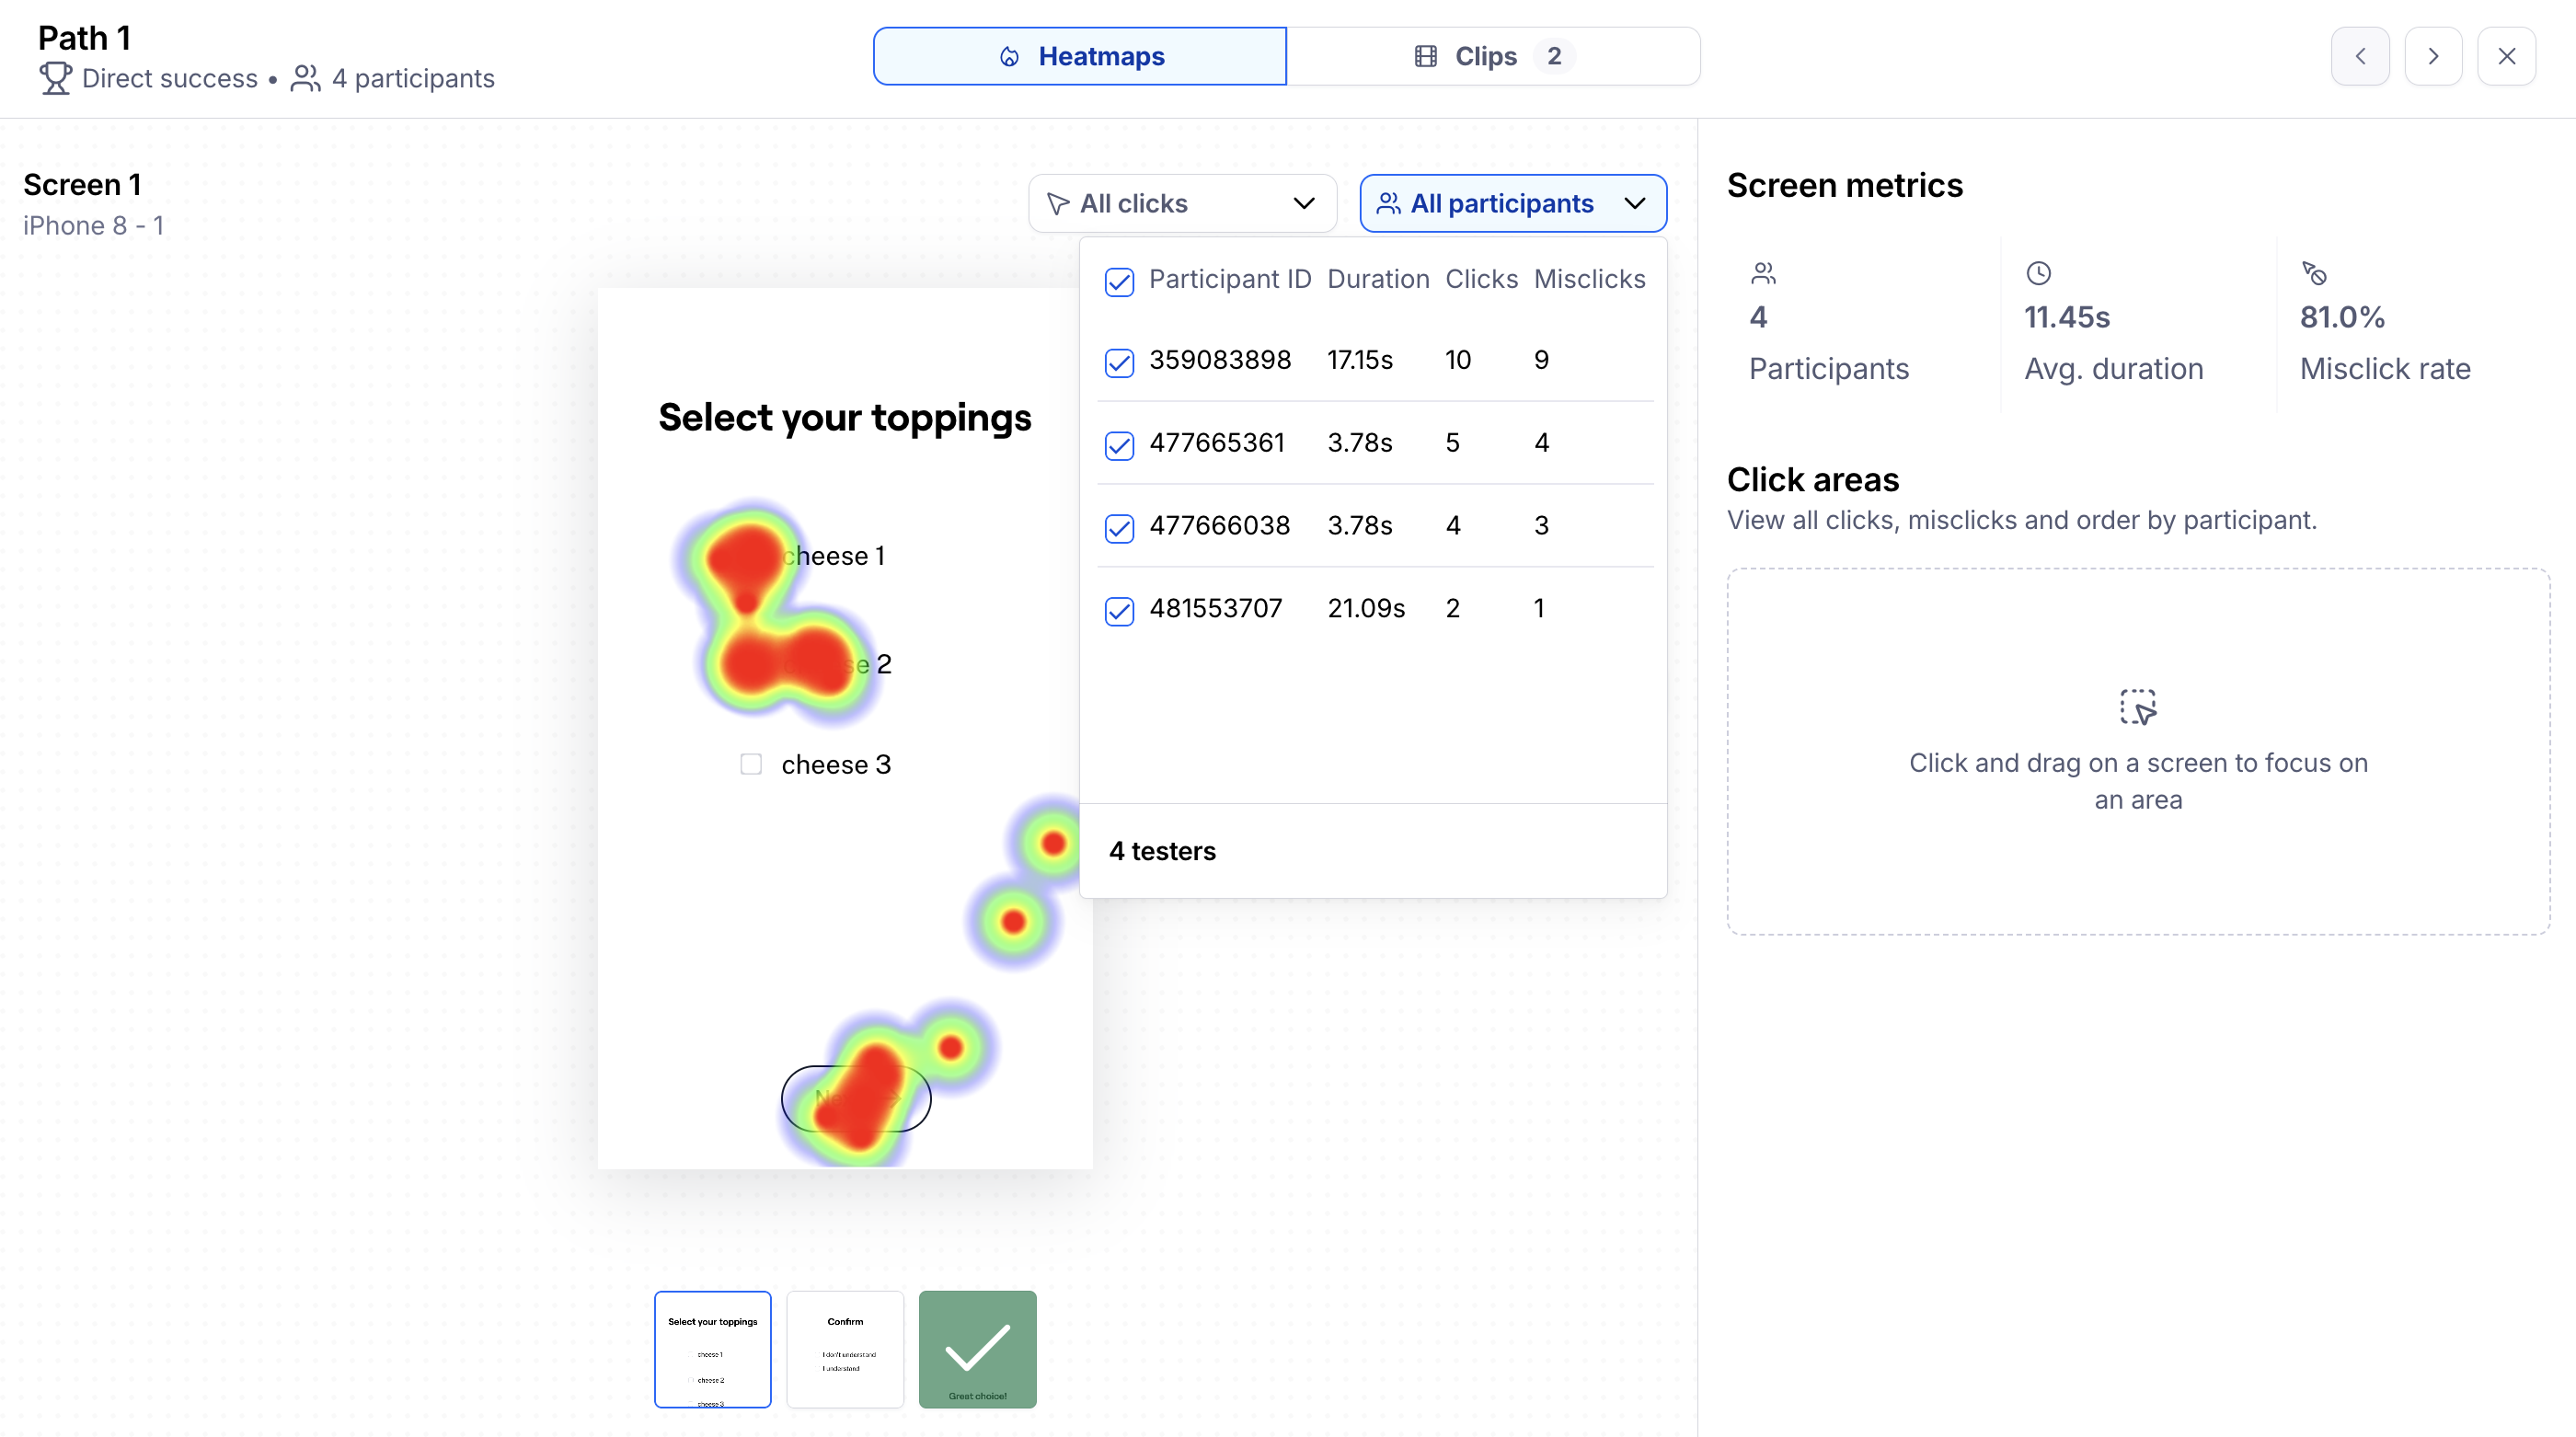
Using the top navigation bar, you can also opt to display only specific participant's interactions.
Click the drop-down and toggle between all participants and selected participants. The drop-down will also show you the following details about each participant's session: unique tester ID, time spent on that screen, and number of clicks and misclicks the participant made on the screen.
This allows you to take a more granular dive into the behavior of specific participants. For instance, if you notice that a particular participant had a higher than usual time on screen or misclick rate, you can view only their heatmap to understand what might have caused that.
Display options
There are three ways to view a click heatmap:
- Heatmap: A graphic representation of clicks on the screen.
- Clicks: Actual click position for each click on the screen.
- Image: A plain image of the screen.
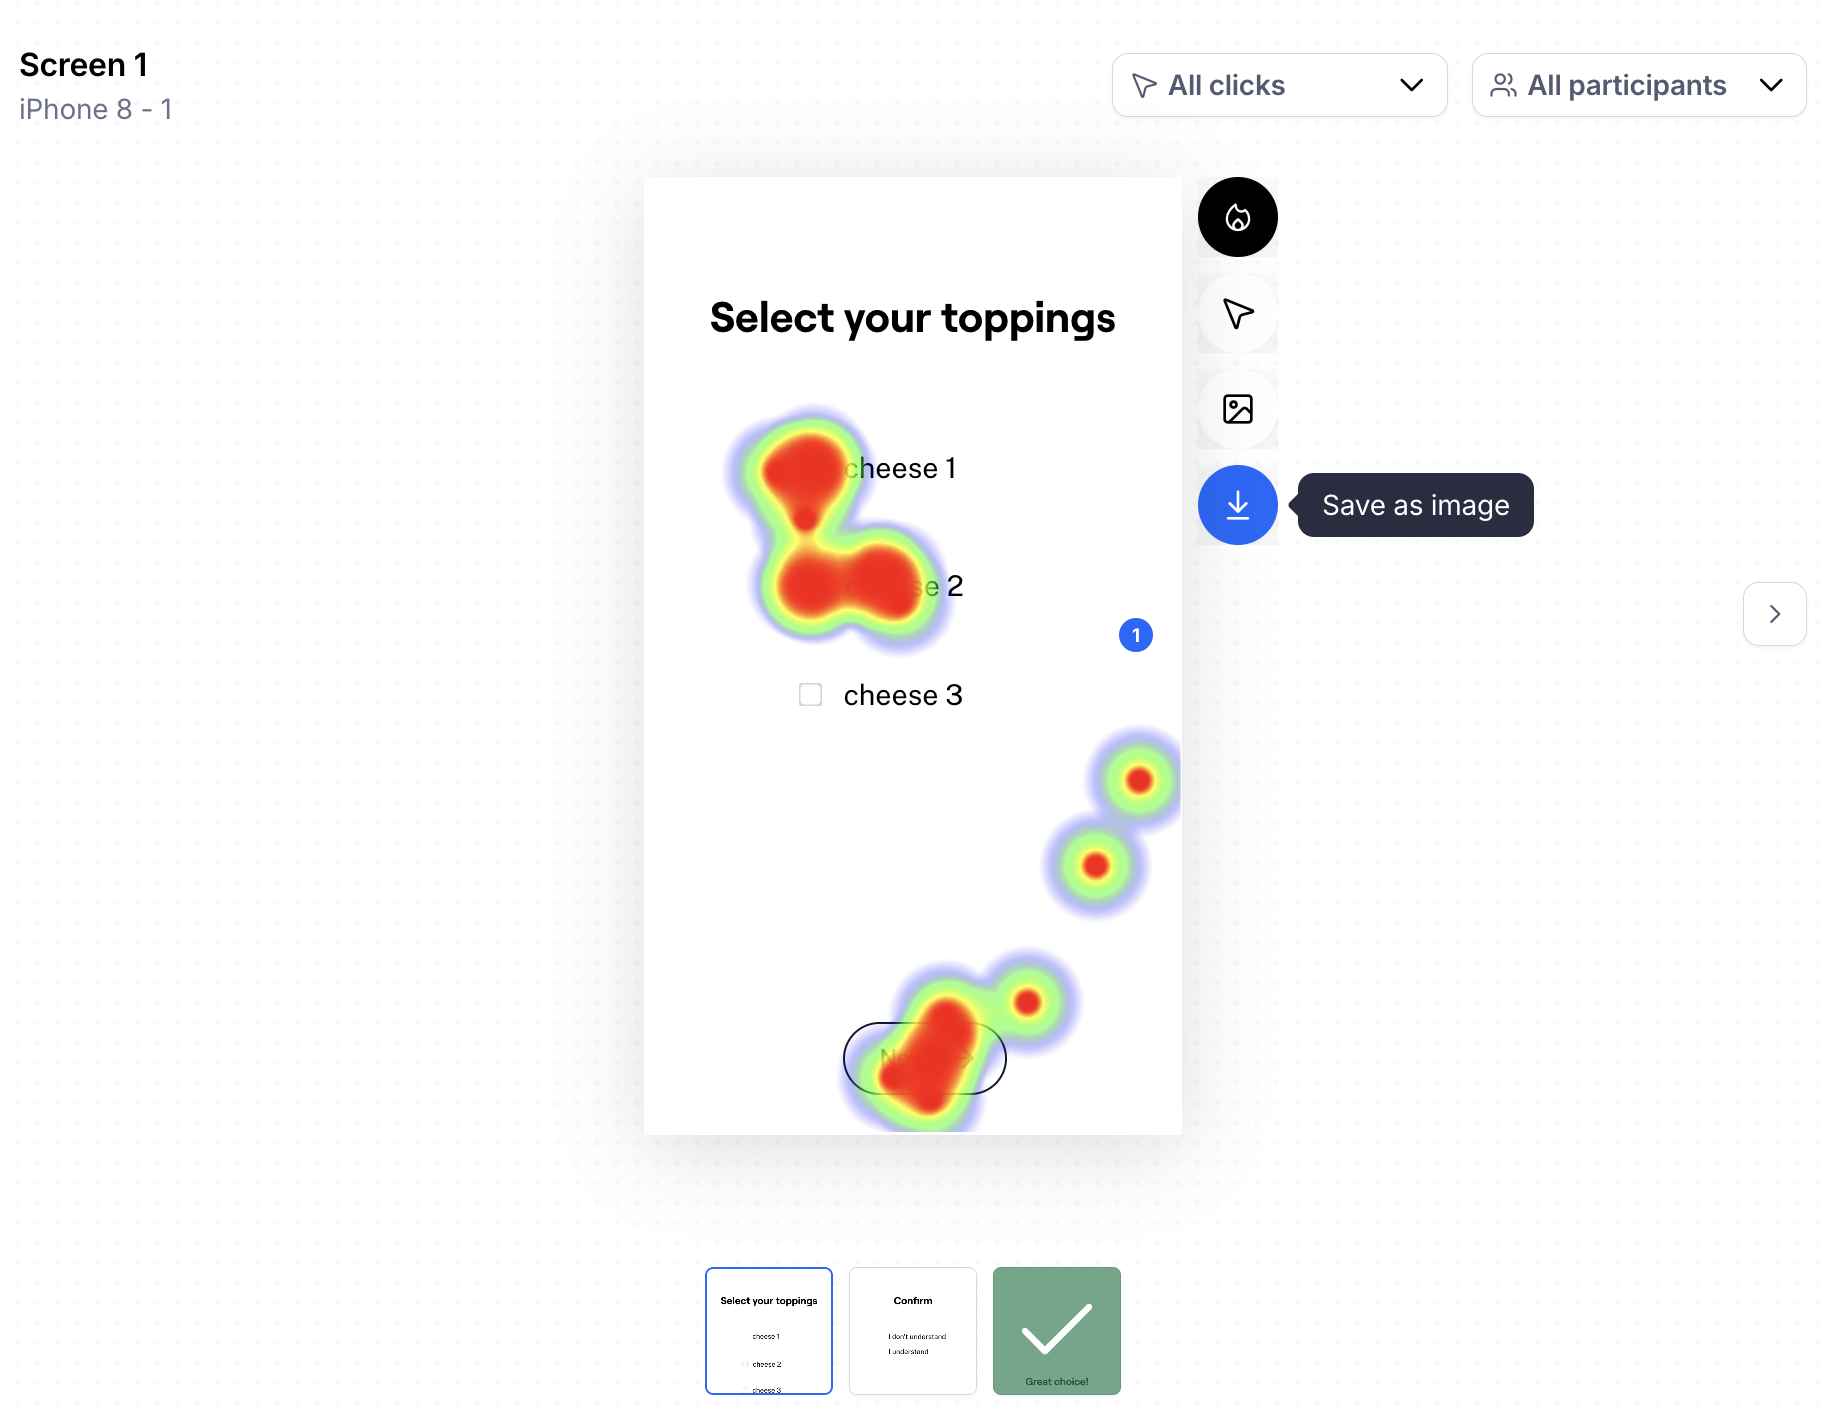
- Save as image: Downloads the heatmap.
To toggle between the different heatmap display options, hover over the screen to reveal the menu and select your desired view.
Download your heatmaps
To download a heatmap, hover over the screen image, and click Save as image on the options menu.
Attachments:
ezgifcom-optimize-10_1o7eq2.gif
testerheatmaps_1xp1tep.gif
ezgifcom-video-to-gif_1mb3c5y.gif
ezgifcom-video-to-gif_yprnfx.gif
ezgifcom-video-to-gif-2_1mo6d7t.gif
ezgifcom-video-to-gif_iyd99c.gif
ezgifcom-video-to-gif_1t0law3.gif
ezgifcom-video-to-gif-3_c0eer9.gif
capture-2019-04-18-at-213607_9dphj1.png
maze-results-website-test-tester-results.webp
maze-results-aggregated-path-overview-open.webp
maze-results-path-heatmap.webp
maze-results-screens-heatmap.webp