[Prototype test] Understanding your prototype test results
Last updated: June 25, 2026
As participants complete your live study, you’ll start seeing insights in the Results dashboard.
The results for prototype test blocks are displayed in four sections:
Usability metrics
Mission paths
Mission screens
Responses
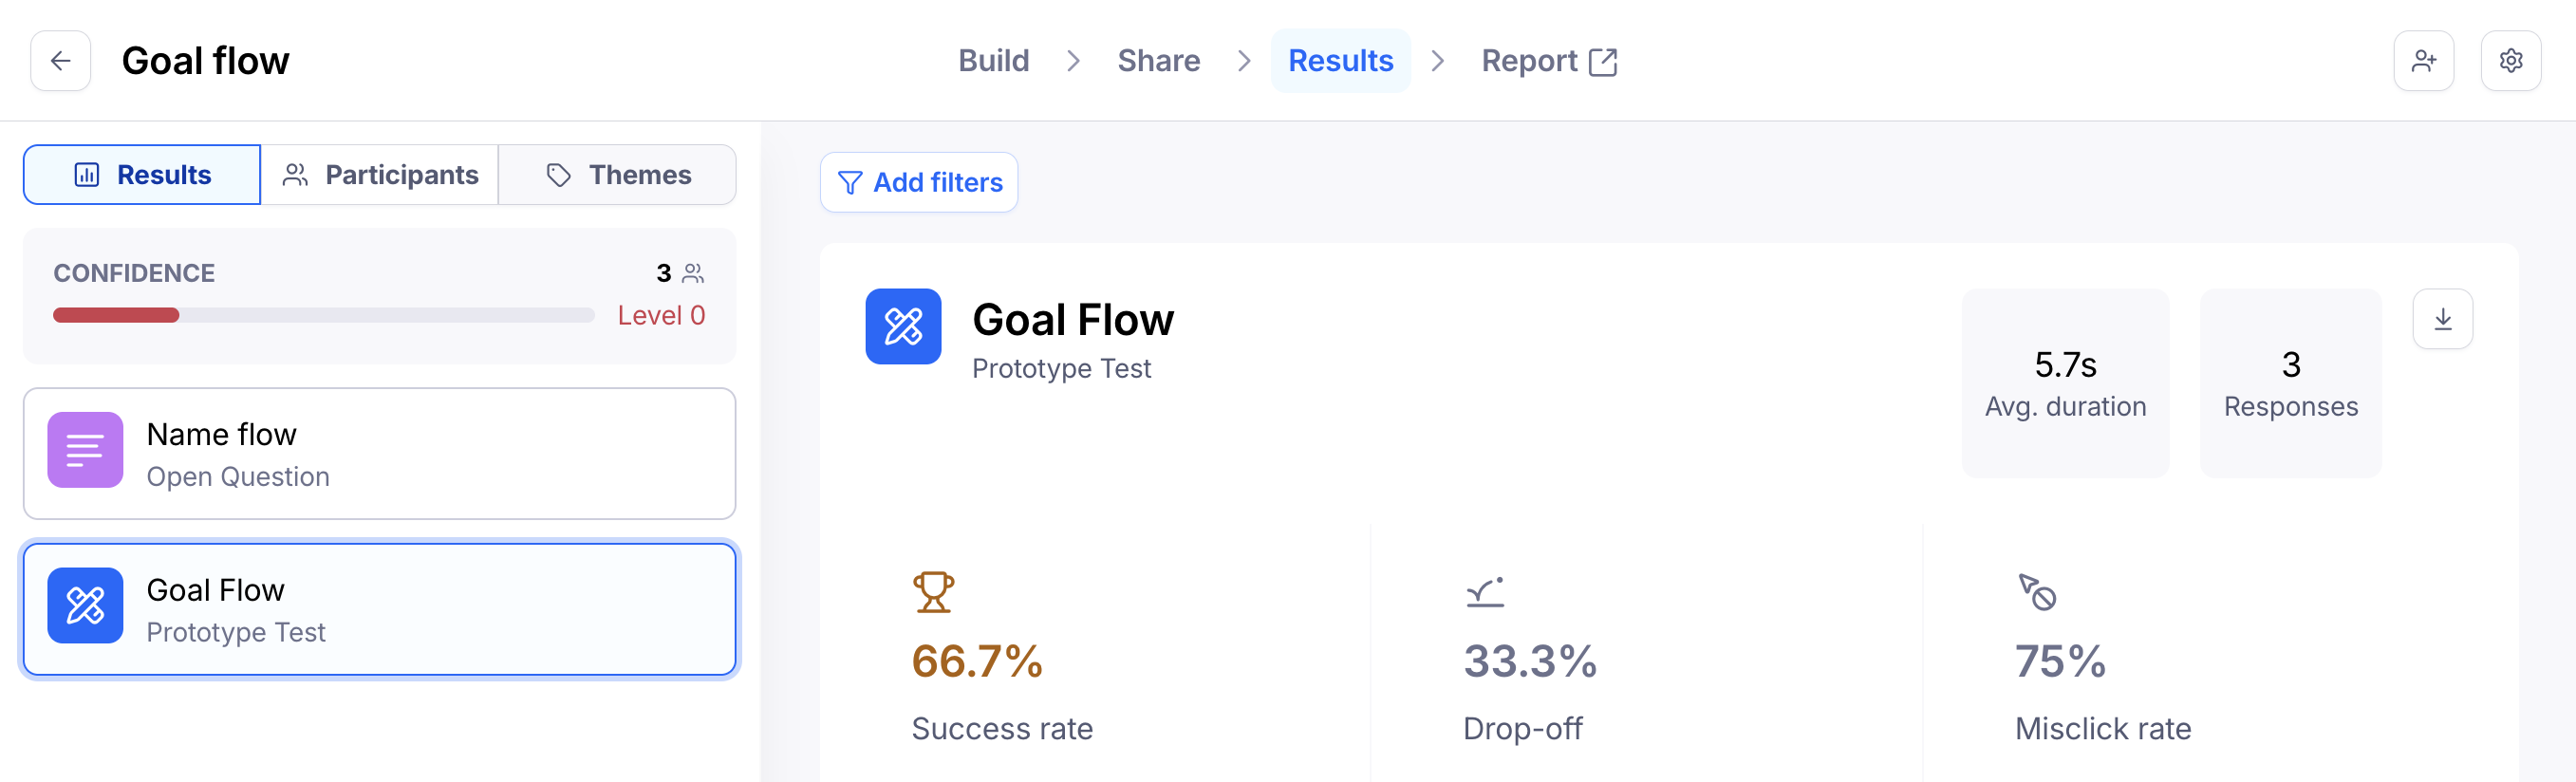
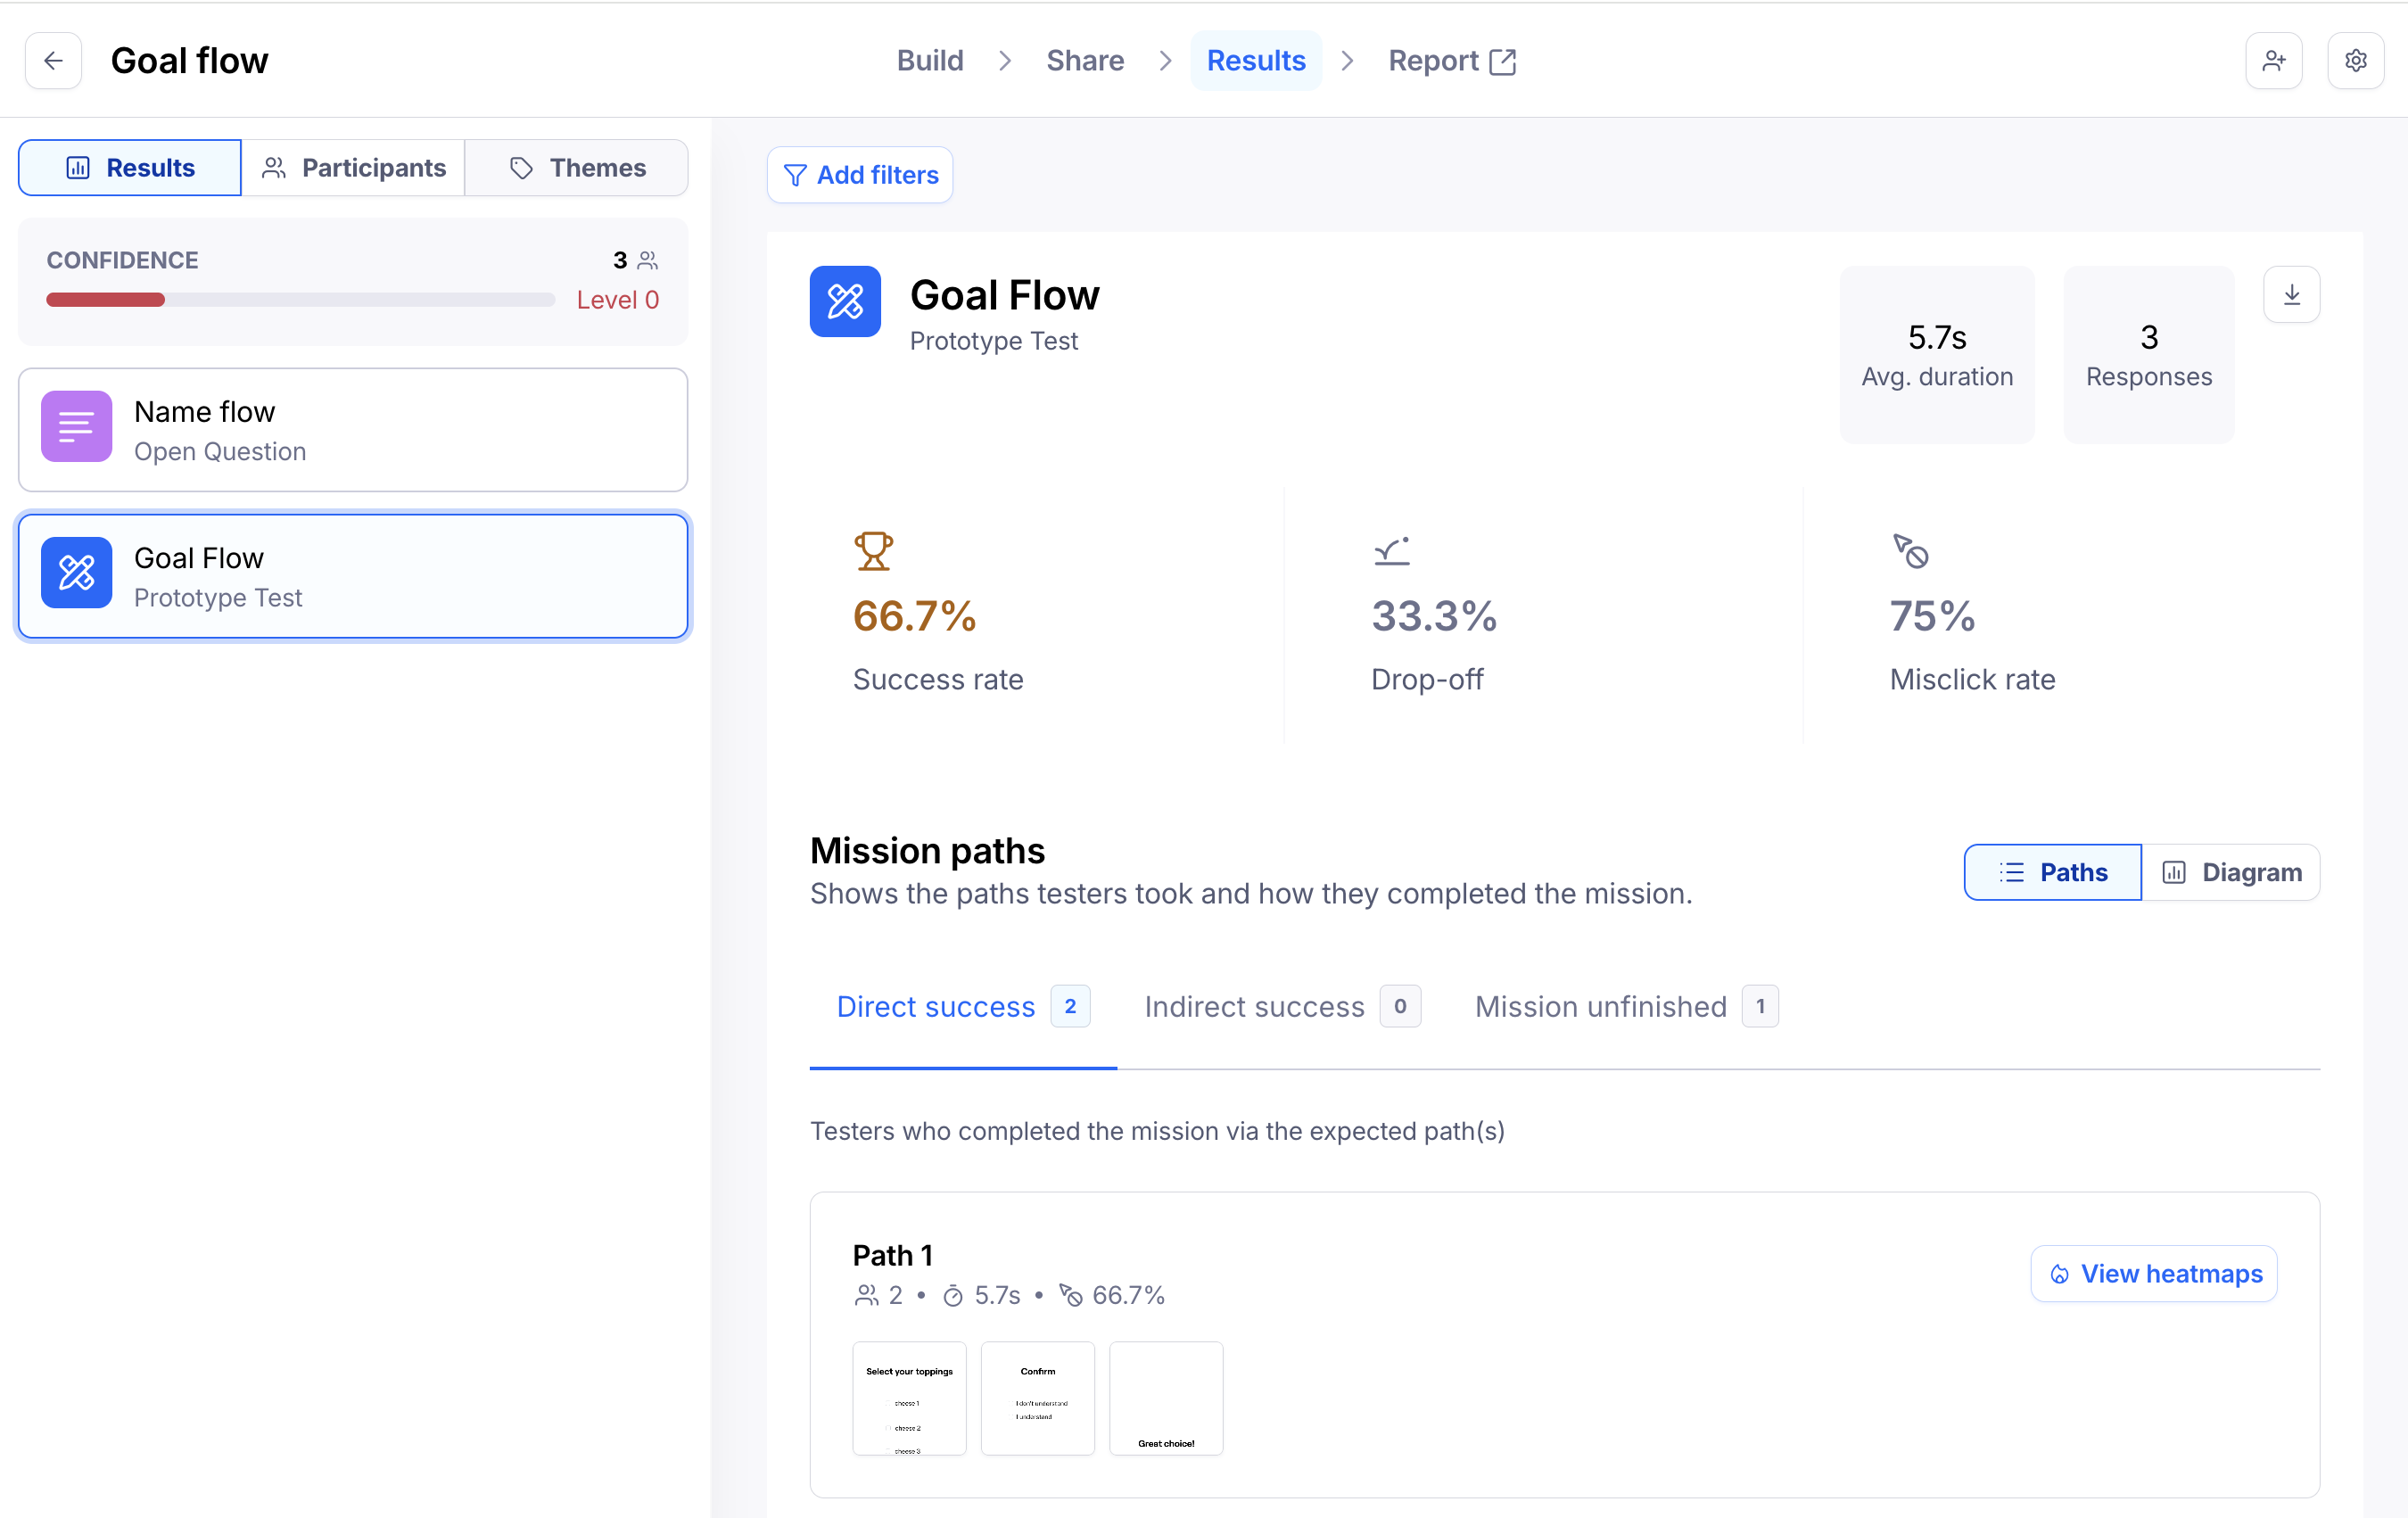
Usability metrics (goal-based missions)
If you’ve set up your prototype test to be goal-based, you’ll see an overview of your mission results at the top of the page:
Success rate: Percentage of missions completed successfully
Drop Off: Percentage of participants who left or finished the mission on the wrong screen
Misclick rate: Average percentage of clicks outside maze hotspots. In a live product, a misclick would have taken the user to an “incorrect” page.
Average duration: Average time testers took to complete the mission
You can also filter your results to see only data for specific mission outcomes. Learn more about filtering your results
Mission paths
This section aggregates the different paths taken by participants. You can visualize paths in two ways:
Paths: Overview of the screens in the path, as well as how many participants took the path and the average duration
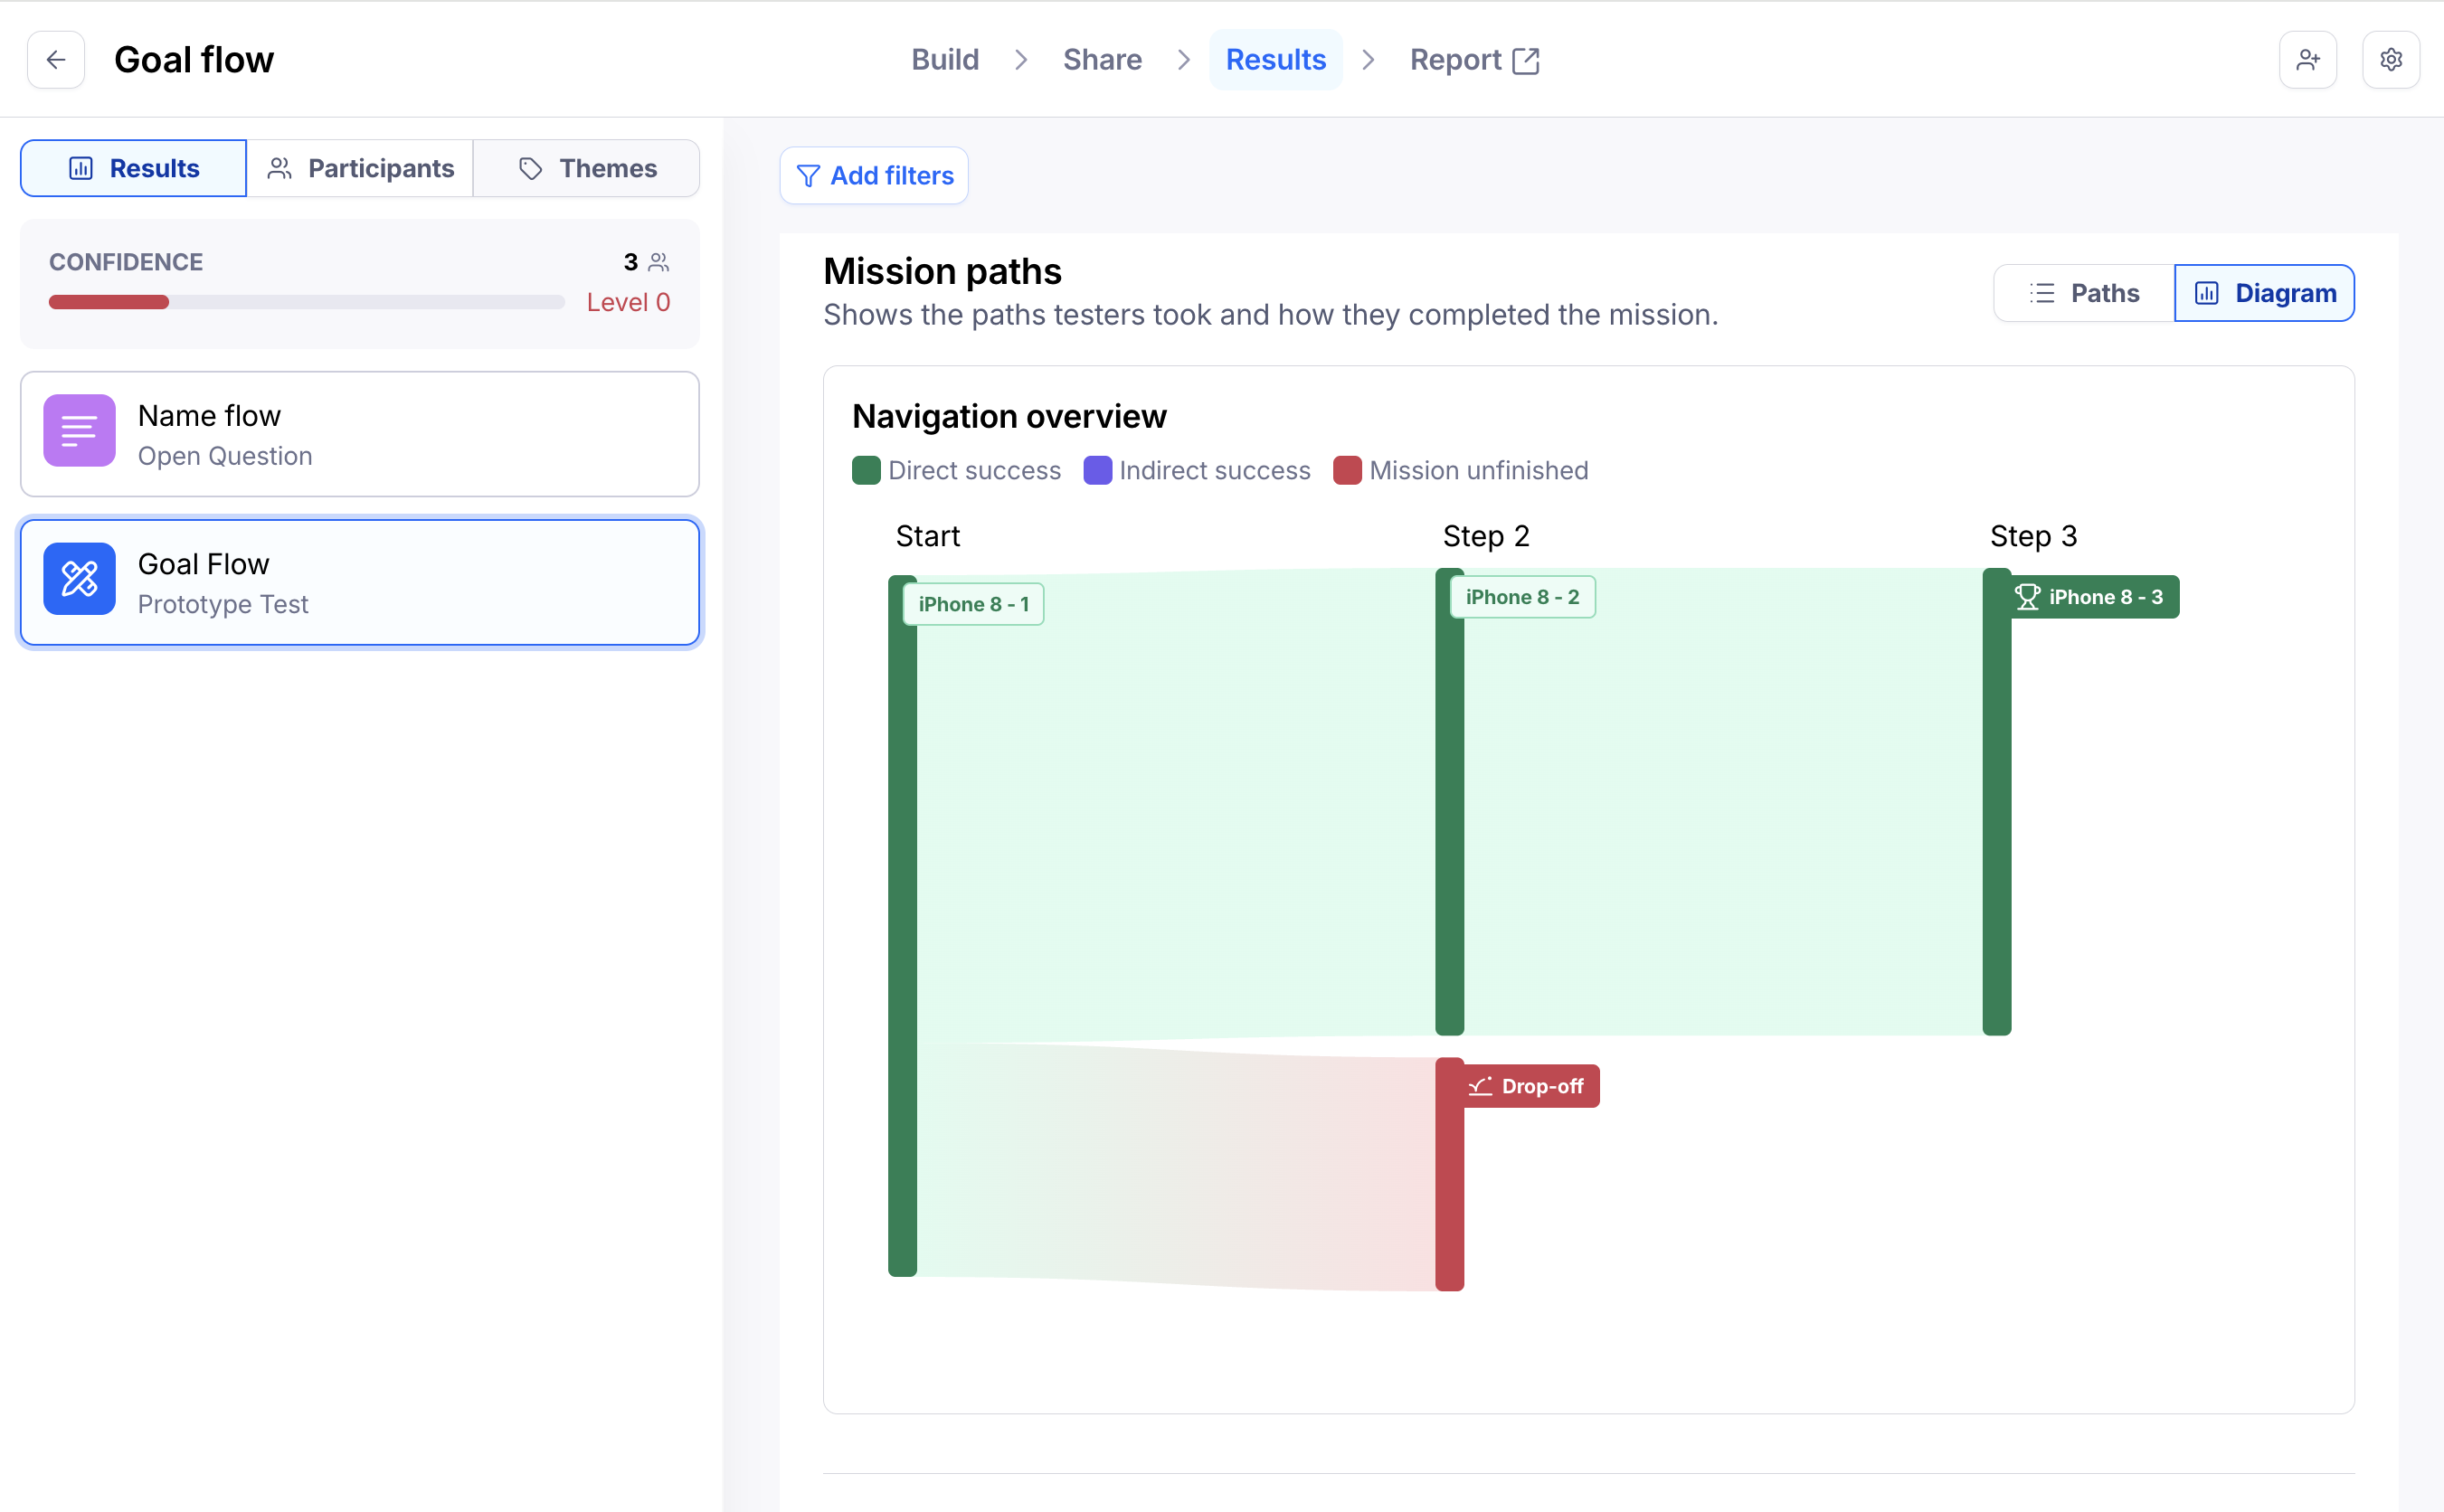
Diagram: Visual representation of how participants flowed through the prototype
Paths
This view will look a bit different depending on whether you’ve set up the prototype test to be goal-based, or free explore.
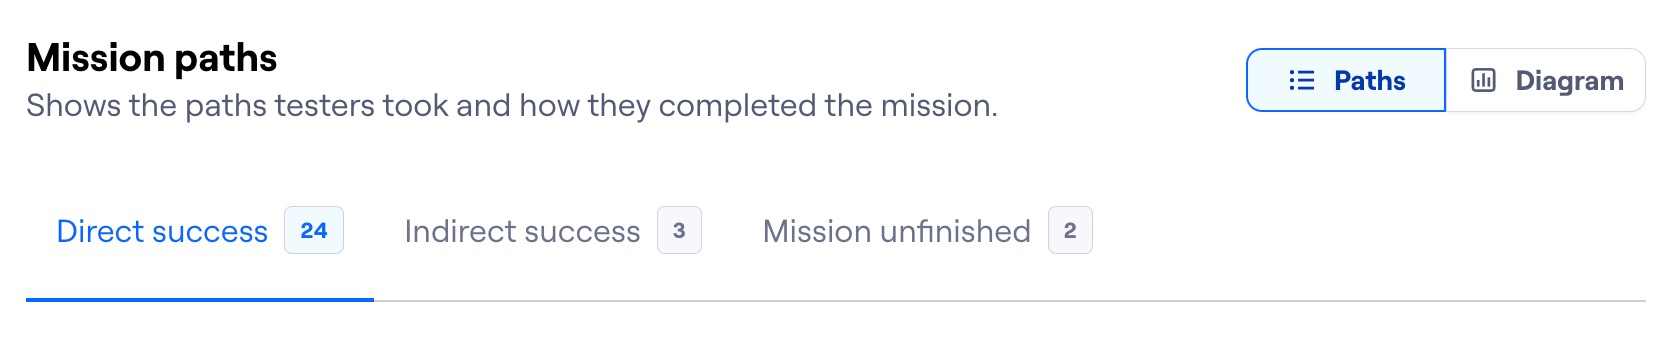
In goal-based missions, this view groups the paths taken by participants based on mission outcome:
Direct success: Participants who completed the mission via an expected path
Indirect success: Participants who completed the mission via an unexpected path, but still reached the final screen
Mission unfinished: Participants who ended the mission on the wrong screen, or abandoned the study
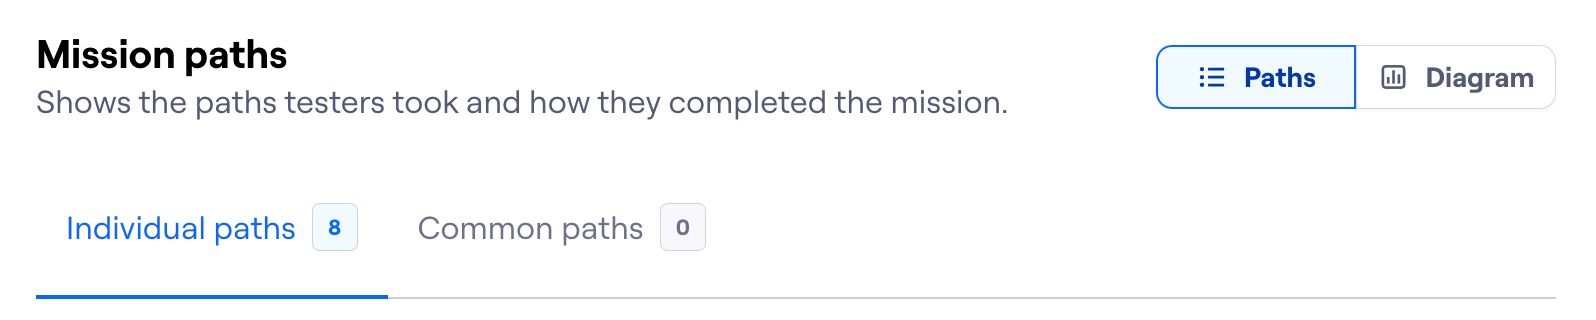
On free explore missions, paths are organized based on how recurrent they were with participants:
Individual paths: Displays individual paths taken by each participant
Common paths: Groups paths based on whether they were taken by two or more participants
Under each tab, you’ll see the paths corresponding to each outcome. The path overview includes the number of participants who took that path, as well as the average time and average misclick rate for all screens within the path.
For more insight on how participants interacted with each path or screen, click View heatmaps or the screen thumbnail. Learn more about heatmaps in Maze
If you’ve enabled Clips, click Watch Clips or open the heatmap view to watch the associated recordings.
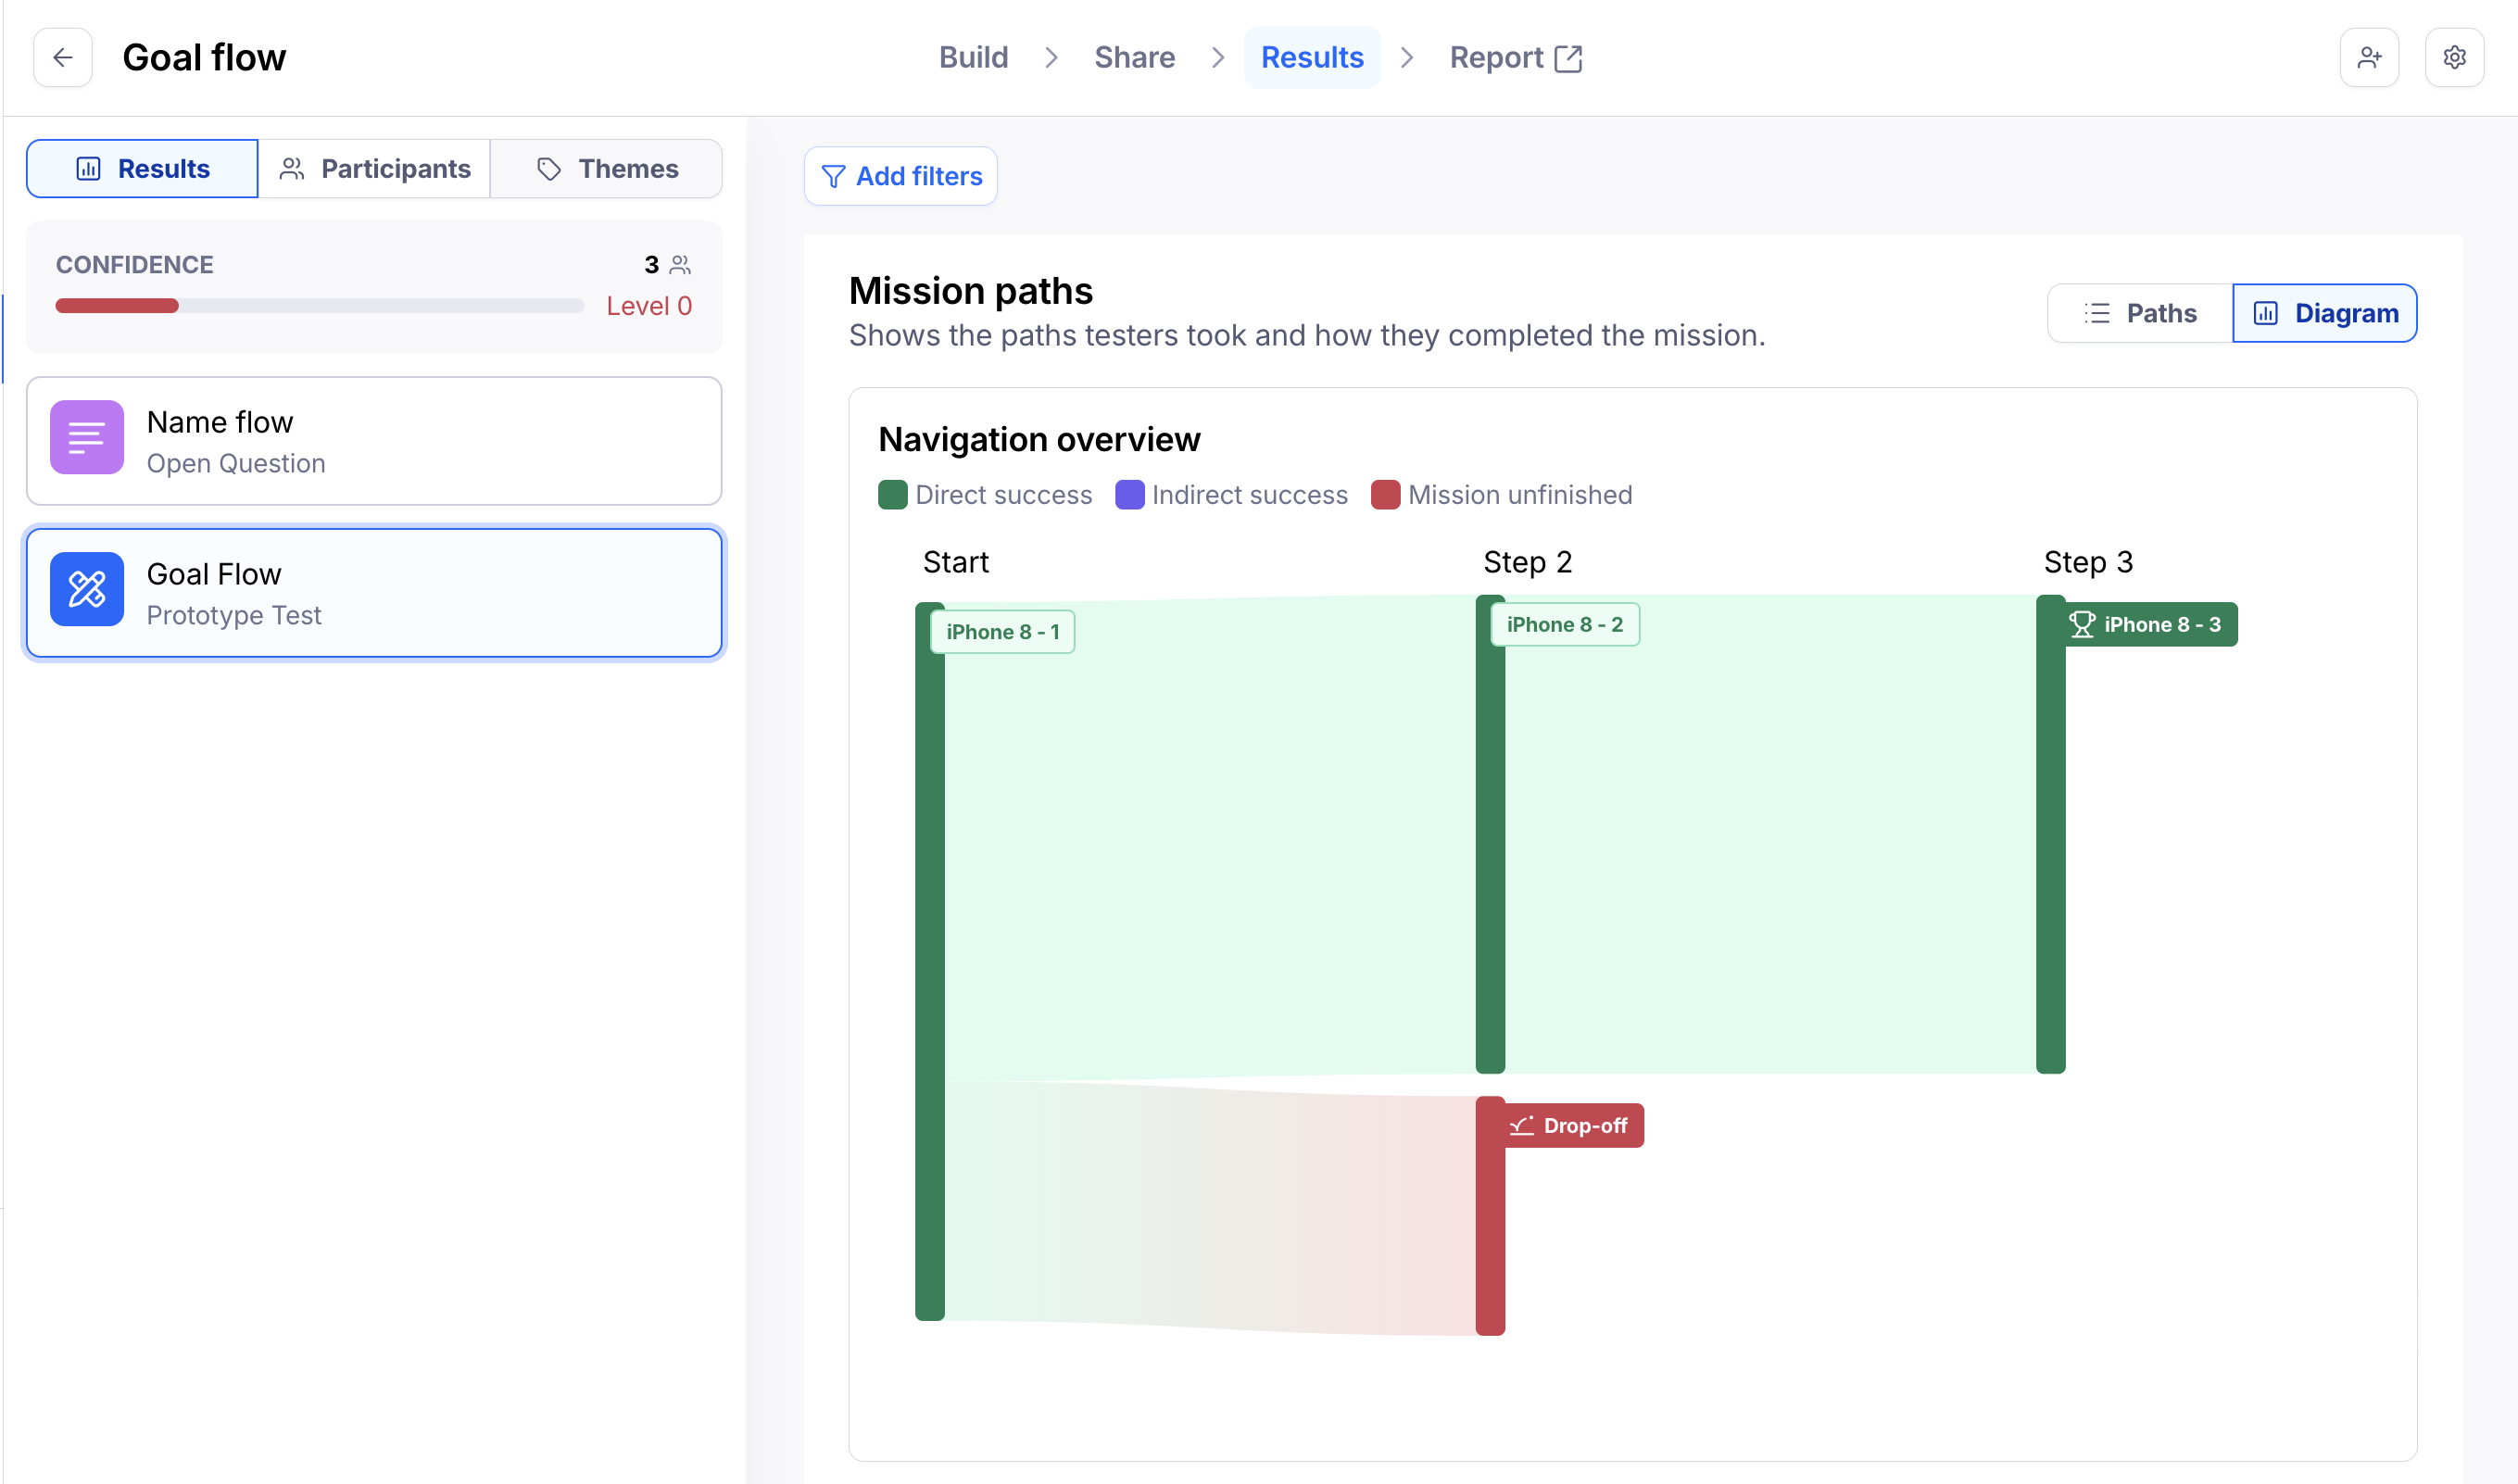
Diagram
The Sankey-style diagram gives you a visual representation of the “desired paths” taken by participants.
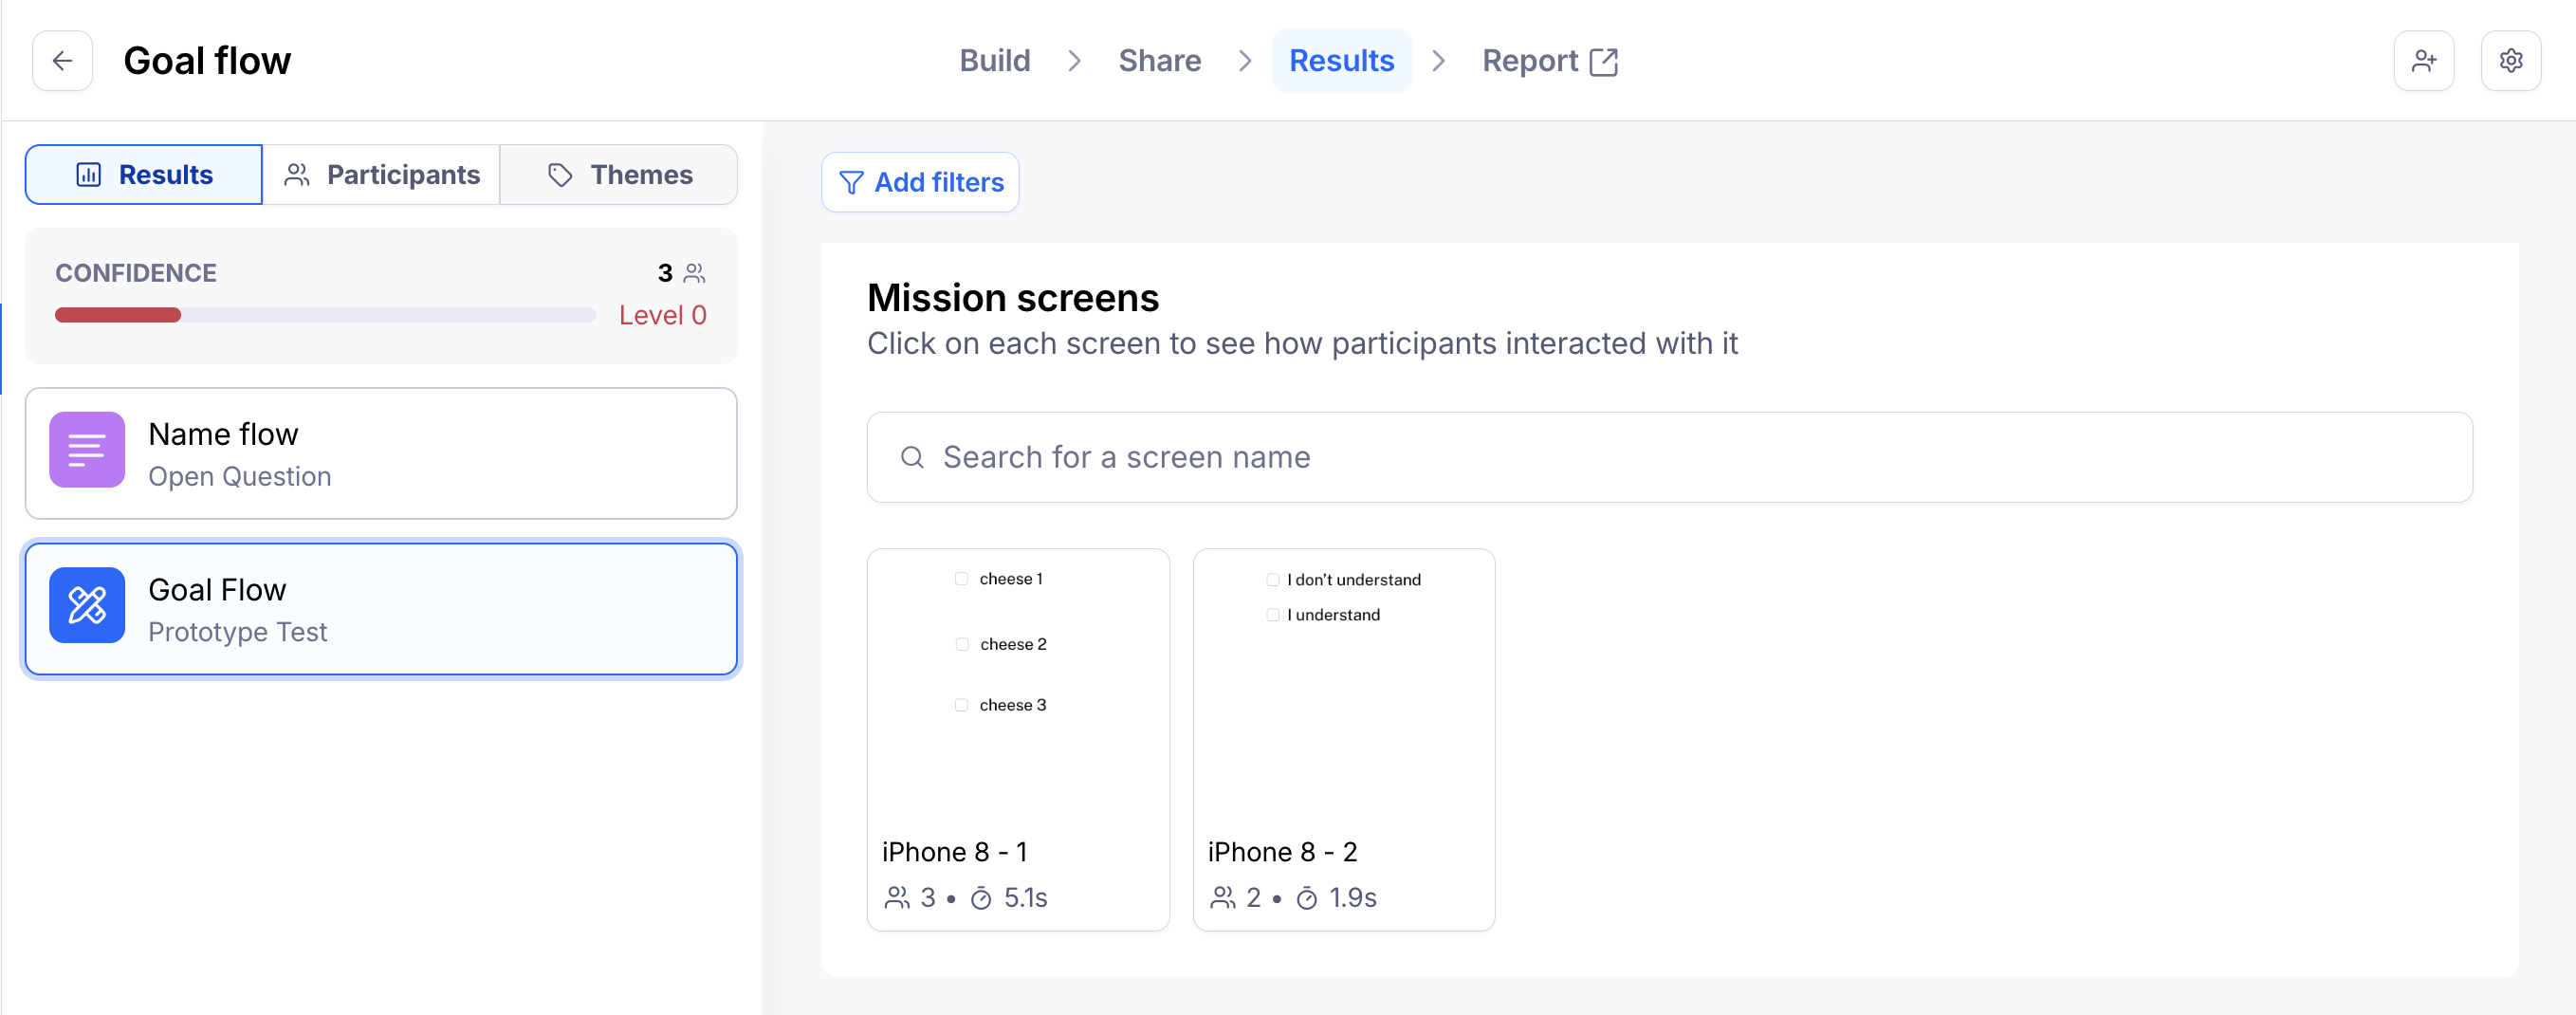
Mission screens
Further down the Results page, you’ll see an overview of all the screens in the prototype. Click each screen to see heatmaps showing how participants interacted with it.
Learn more about heatmaps in Maze
Responses
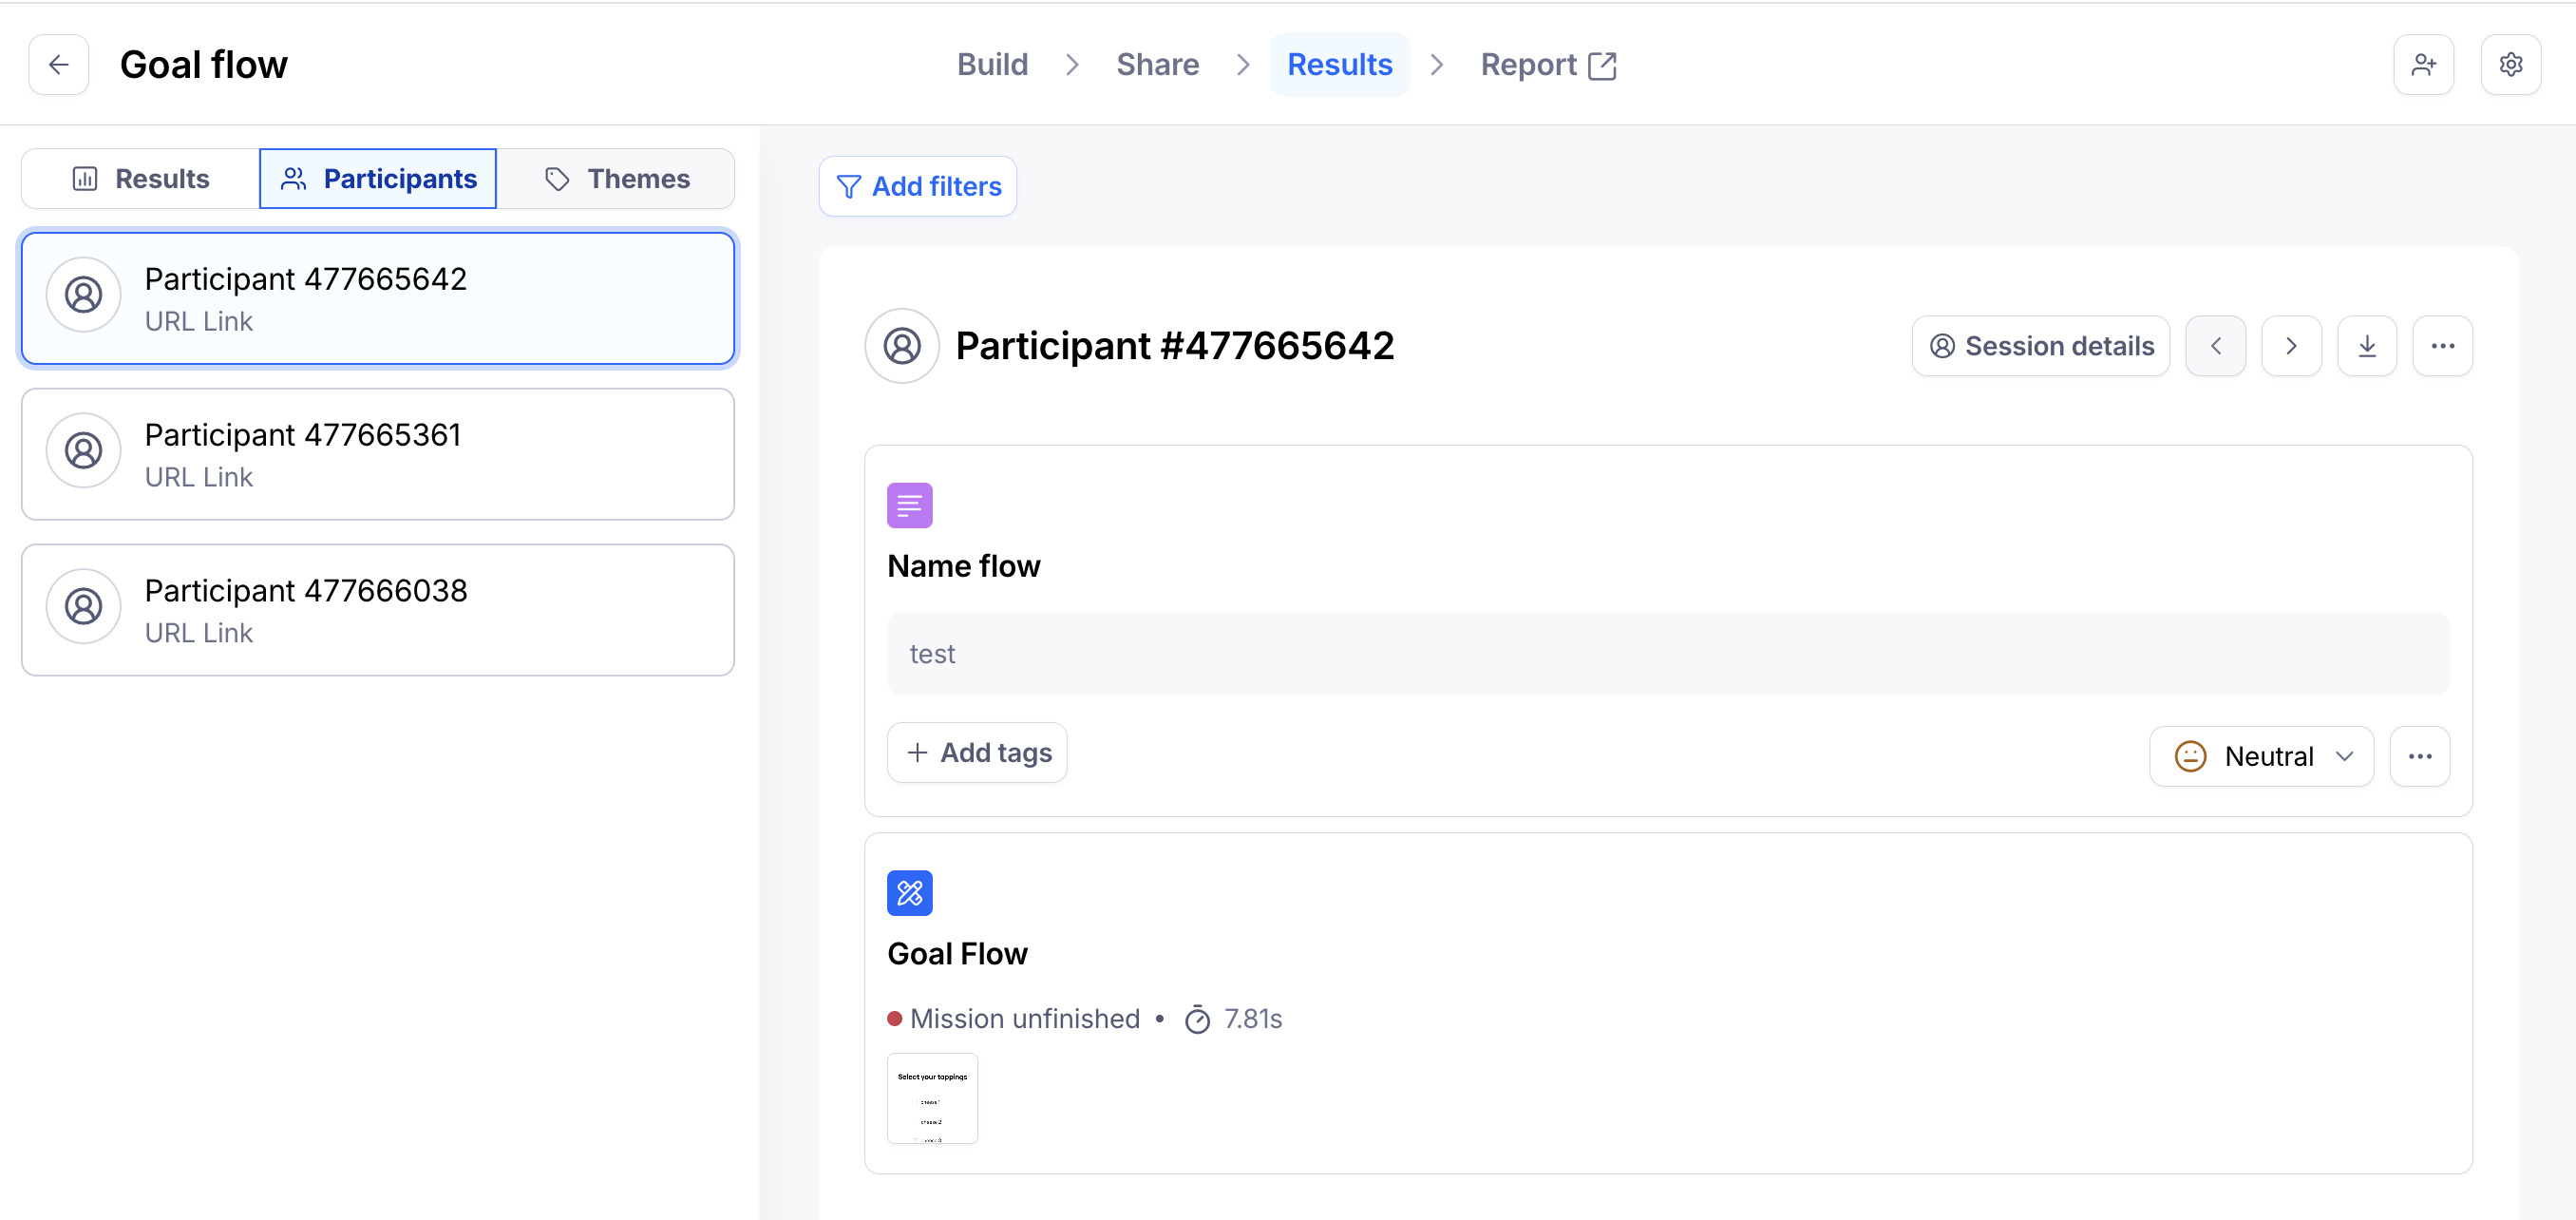
At the end of the Results page you’ll find the Responses section.
Here you can find the test details for each participant in the study.
Clips: Whether there are saved screen and/or audio and video recordings from the mission
Participant: The individual participant’s ID
Outcome: On goal-based tests, whether the mission resulted in a direct success, or wasn’t complete
Duration: How long it took for the participant to complete the mission
Participant path: A thumbnail preview of the first four screens of the path taken by the participant
Responded at: The date and time of the test
Actions: If there are Clips associated with that response, you have the option to add that recording to a reel, and/or share that specific clip. Learn more about sharing Clips
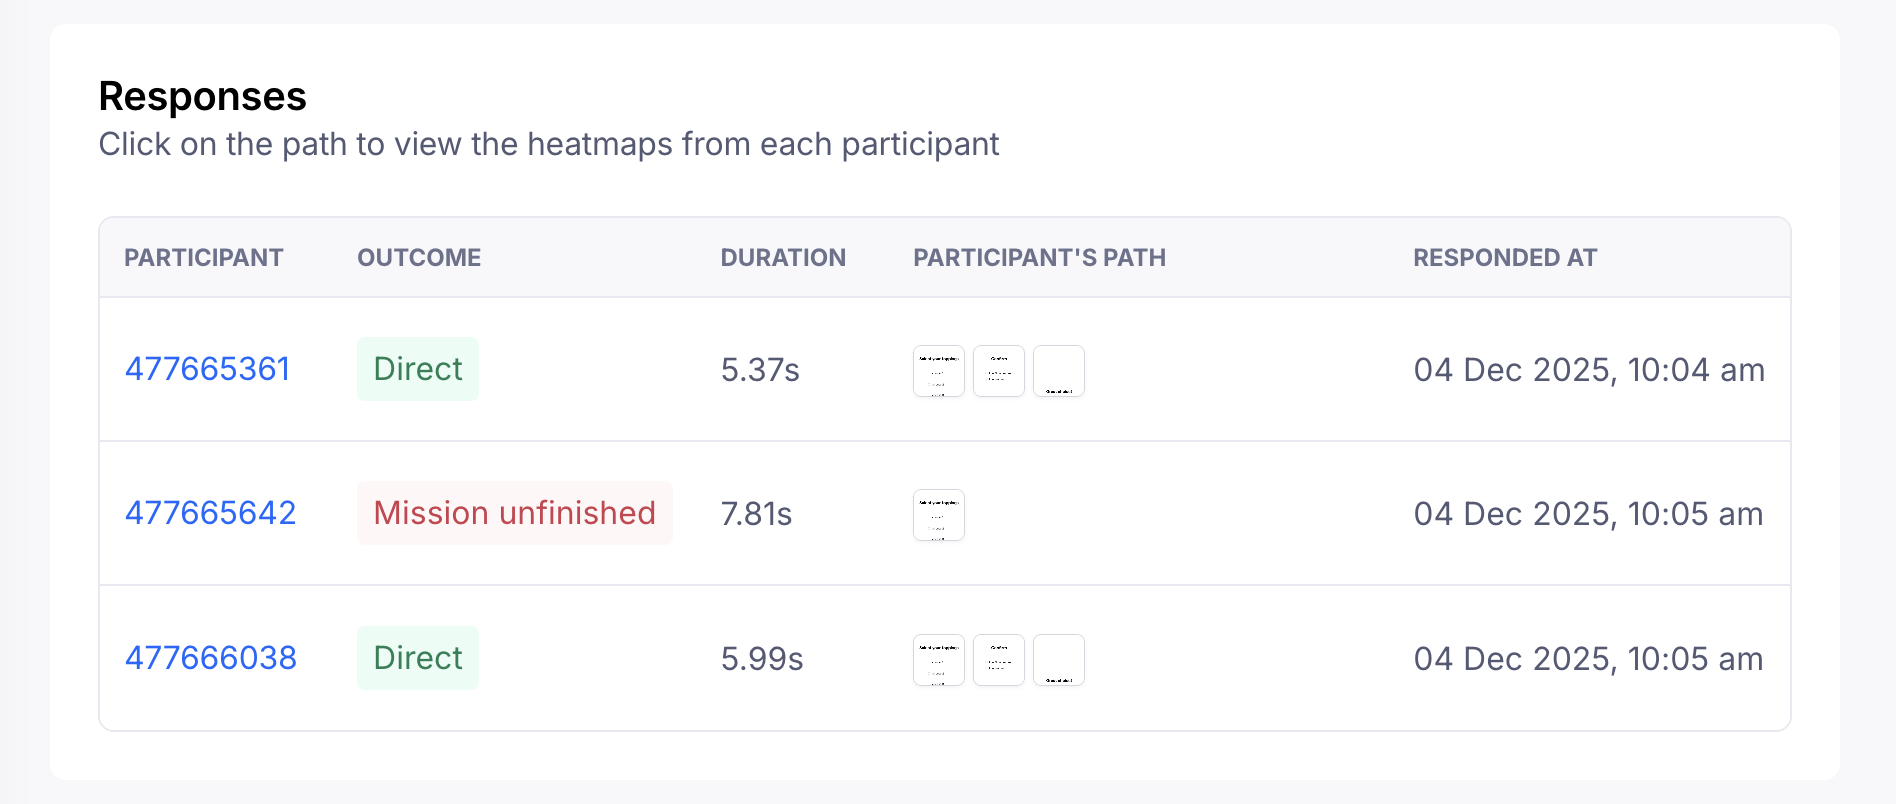
Click each row to see the specific path they’ve taken on the mission.
Click View session to see that participant’s responses to the study.
How many participants do I need?
The number of participants you need depends on the type of research you're running. Maze recommends testing with:
At least 10 participants for unmoderated studies
At least 10 participants for AI-moderated studies
At least 5 participants for moderated studies
Learn more about the ideal number of participants
Filter your results
When reviewing your results, it can be helpful to refine the data to help you answer specific questions.
Filters allow you to narrow down results data based on participant metadata or by block answer/outcome.
Learn more about results filtering
Reports
Maze reports make it easy to analyze, share, and present your results data. Reports are automatically generated for every live study tested with at least one tester.
Export your results
To export your results data, open the More menu (•••) and click Export as CSV file or Export as image.
Still need help?
If you have any questions or concerns, please let our Support team know — we'll be happy to help!