Open card sorting results
Last updated: June 25, 2026
In an open card sort block, testers group cards into categories they create and name. This more flexible approach works well in the early stages of a project, when you're looking to get a more accurate grasp of your users' mental models for grouping and labeling content.
Learn more about creating open card sort tests
As testers complete your live maze, you will start seeing insights on the Results dashboard.
This article shows you how to interact with your open card sort results. To learn more about card sort results, check out this article: Understanding your card sorting results
Open card sorting is available on the Enterprise plan.
Created categories
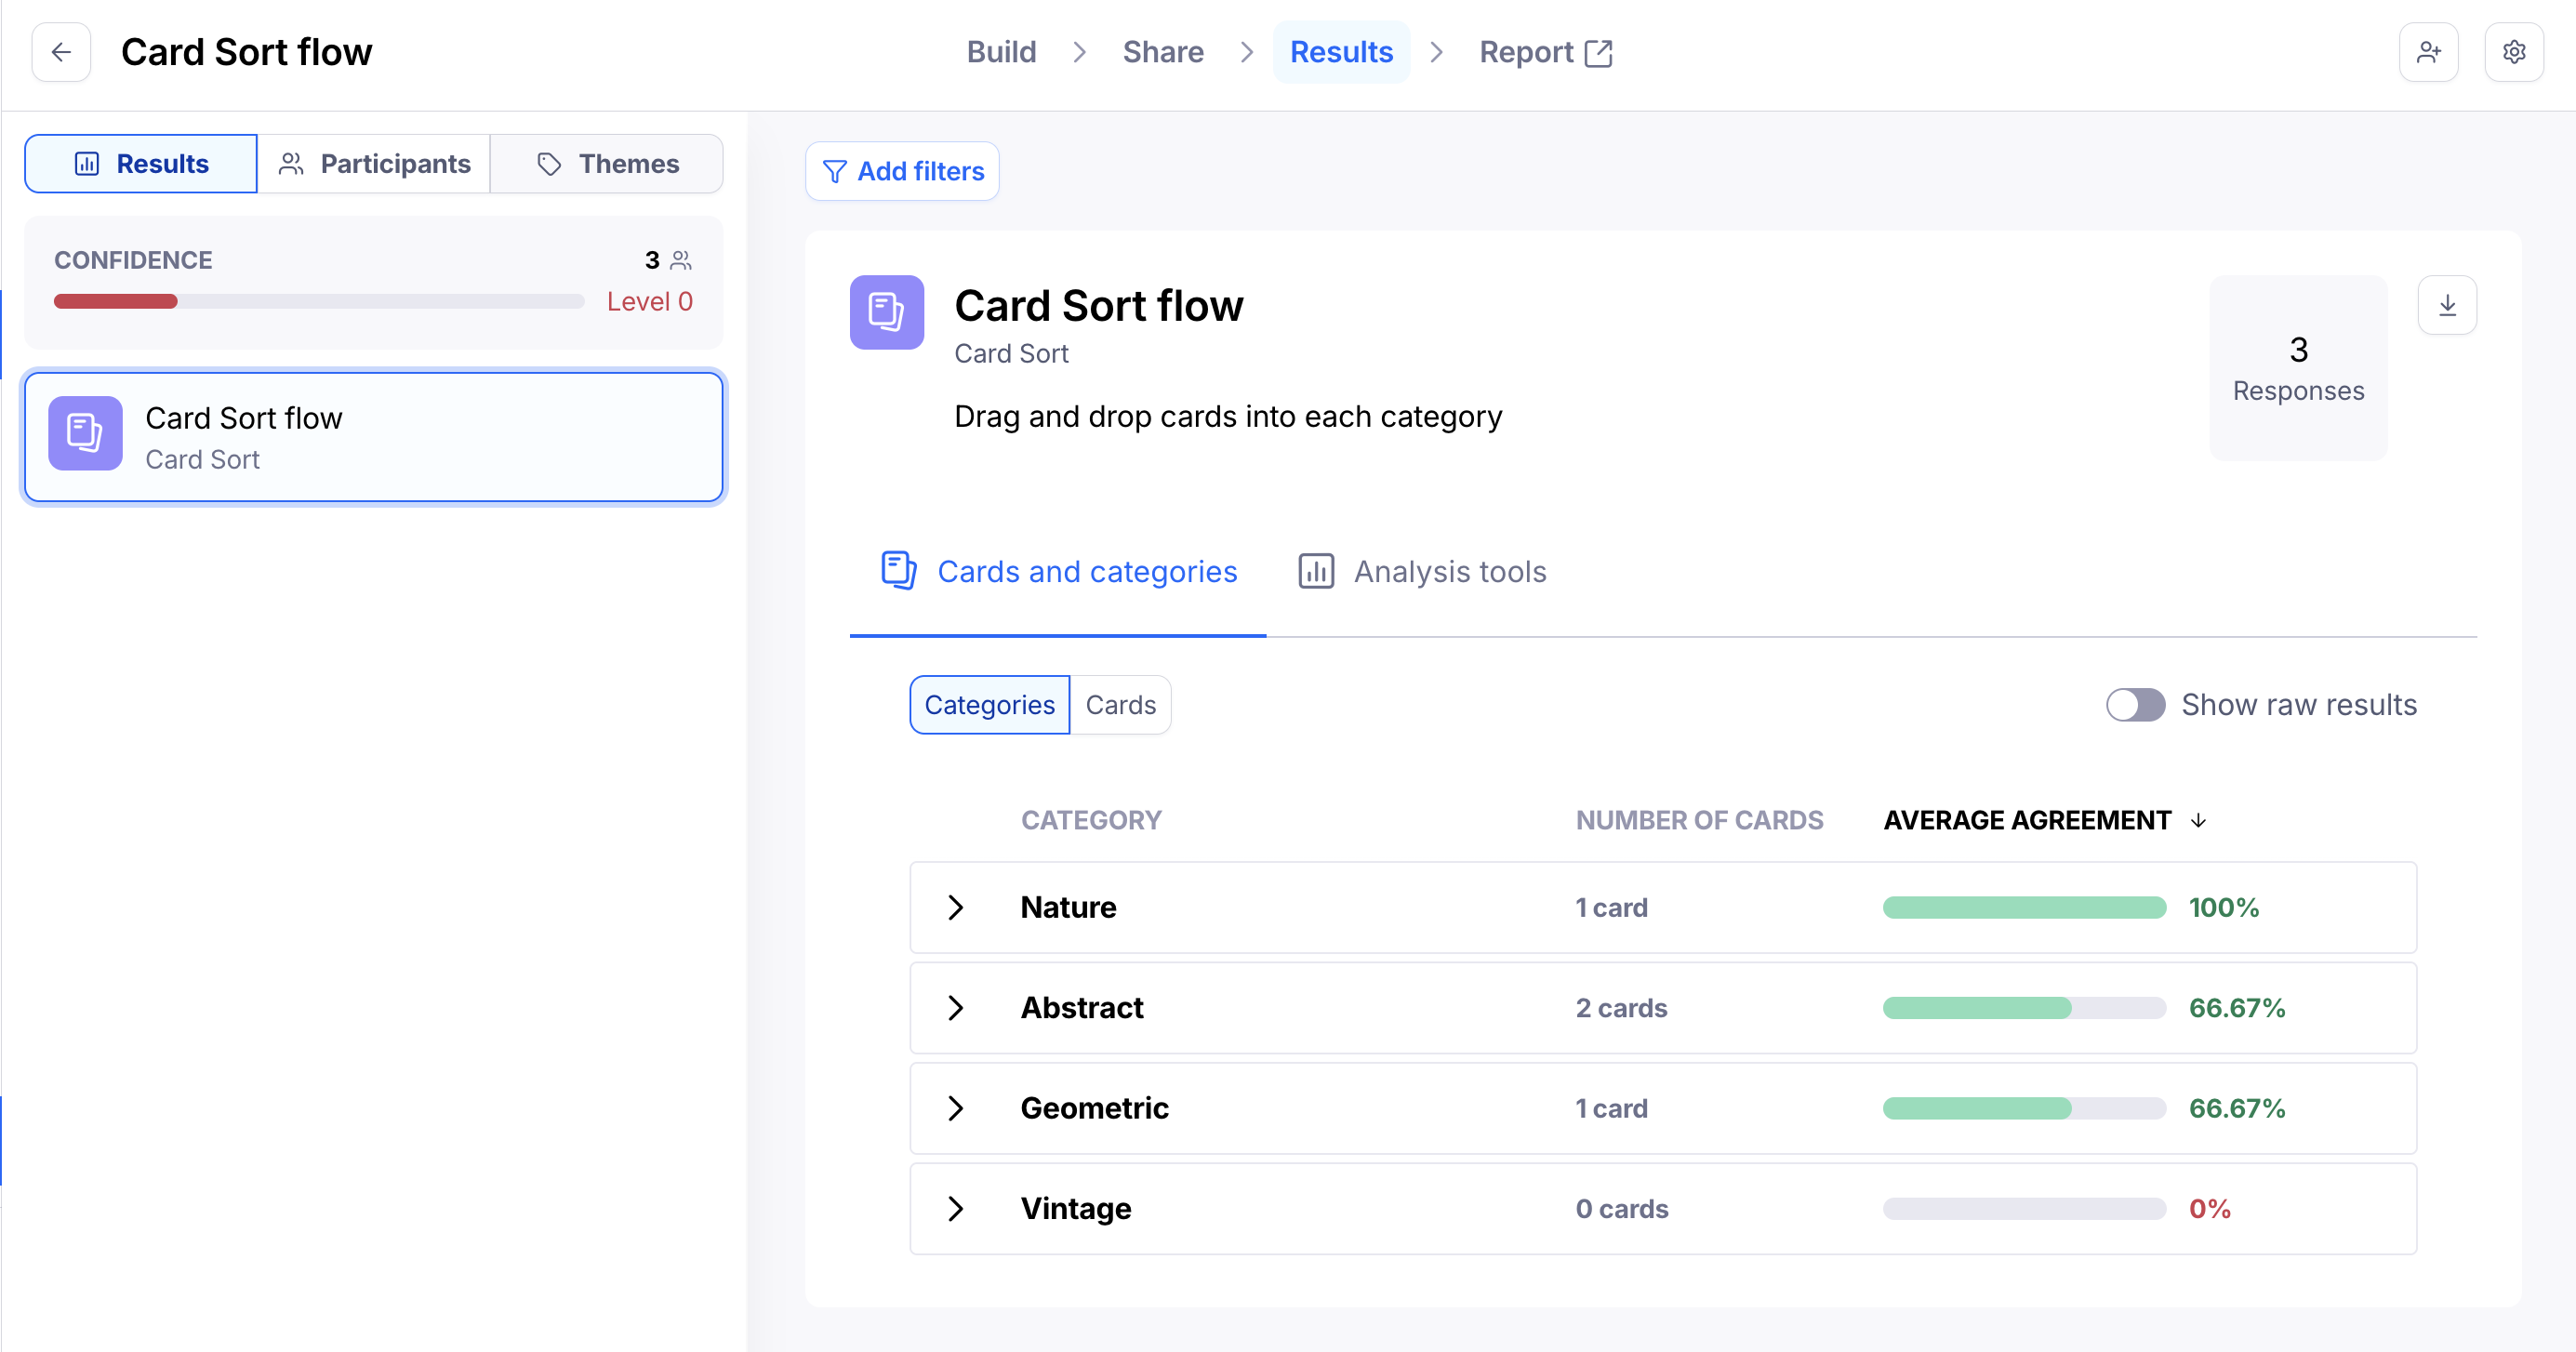
When viewing your maze results, categories with the exact same name are auto-combined by default. For instance, if multiple people created a "Lunch" category, those results are all grouped together.
The dashboard shows you the average agreement for all cards in each of these aggregated categories.
To identify at a glance the categories with the highest and lowest average agreement rates, sort by average agreement.
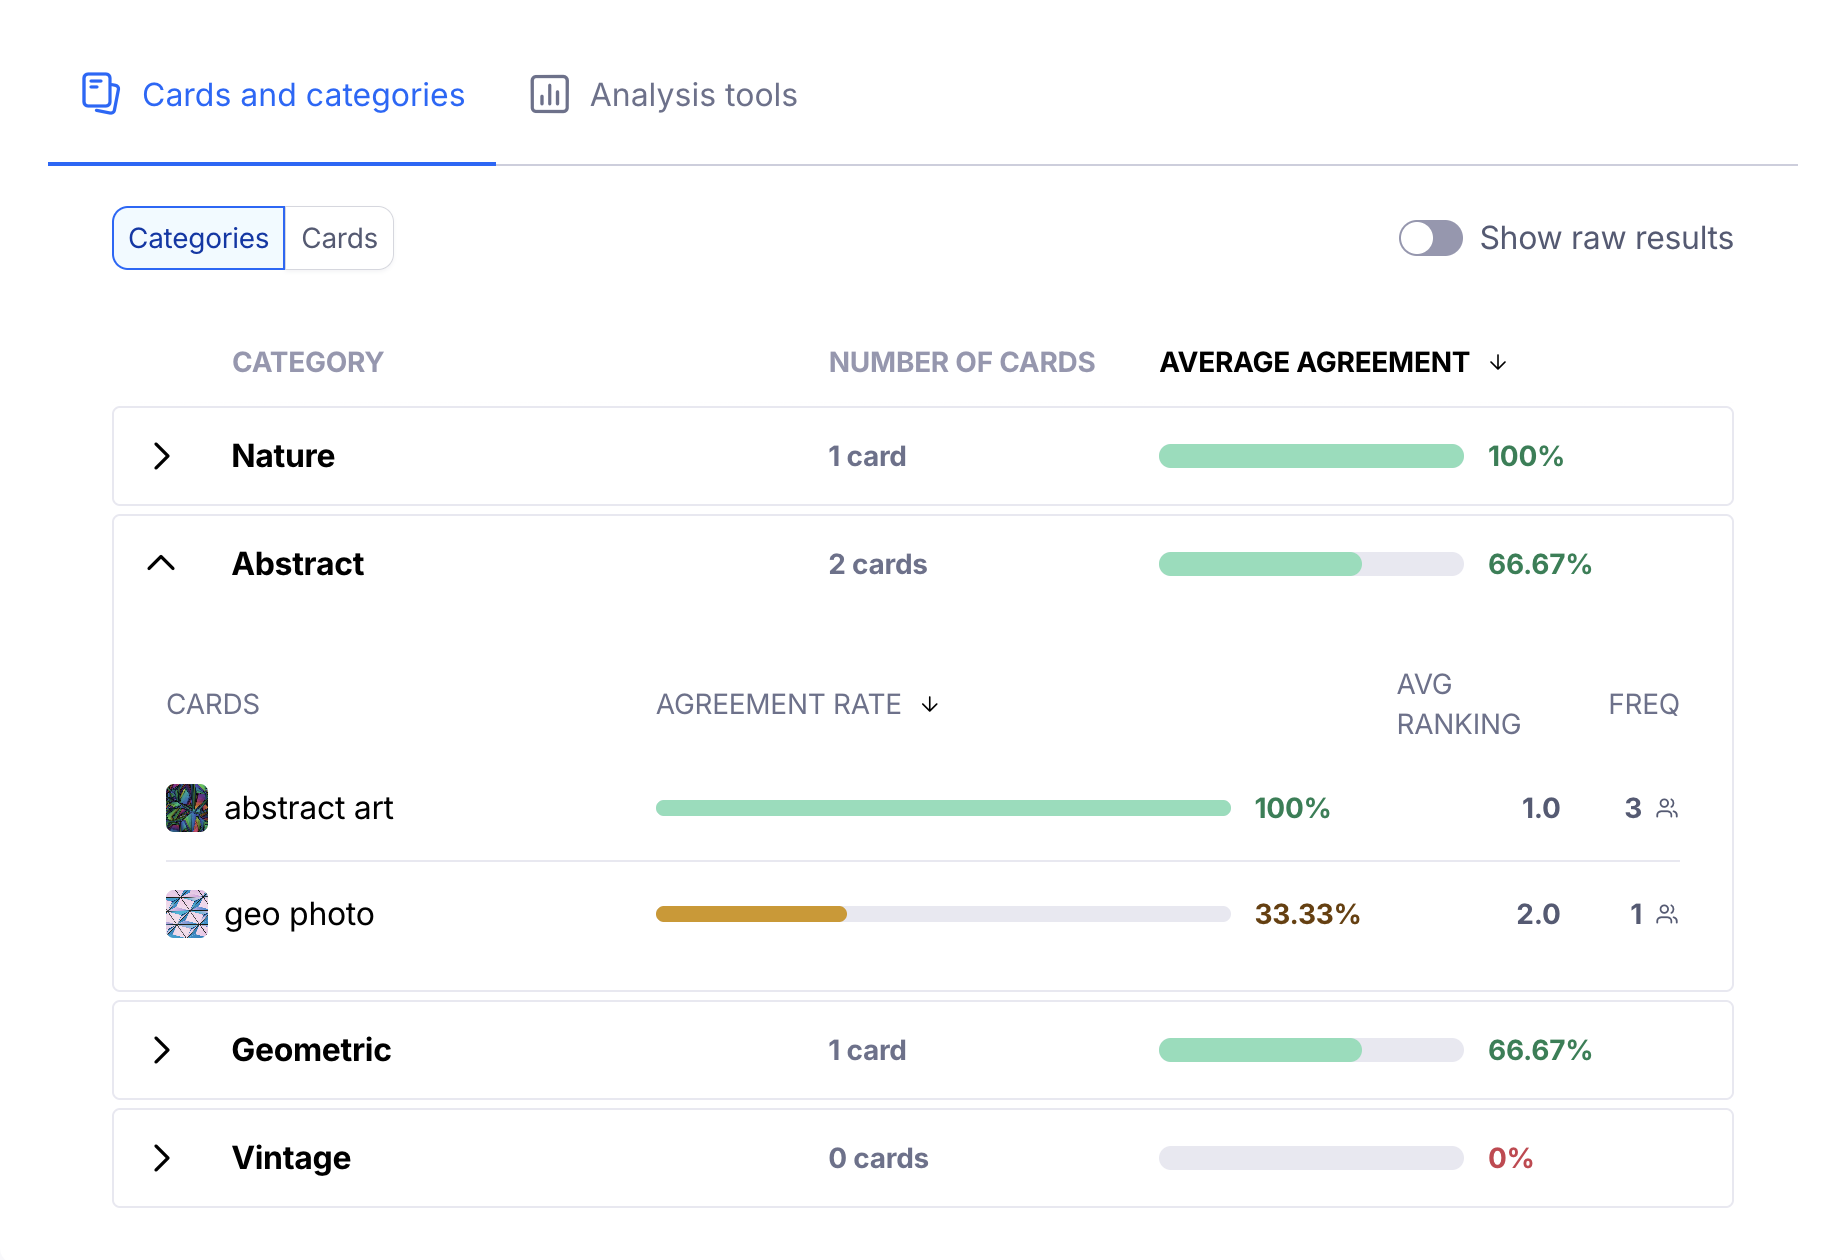
If you expand the category, you'll see which cards have been sorted into that category, the single card agreement rate for each of those cards, and how many people sorted each card into that category (frequency).
This can be a powerful insight into how your testers think. In the example screenshot below, we see that 100% of the testers agree that "abstract art" falls under "Abstract".
We can also identify an outlier: the card "geo photo" appears grouped under this category, though only 1 tester made that choice.
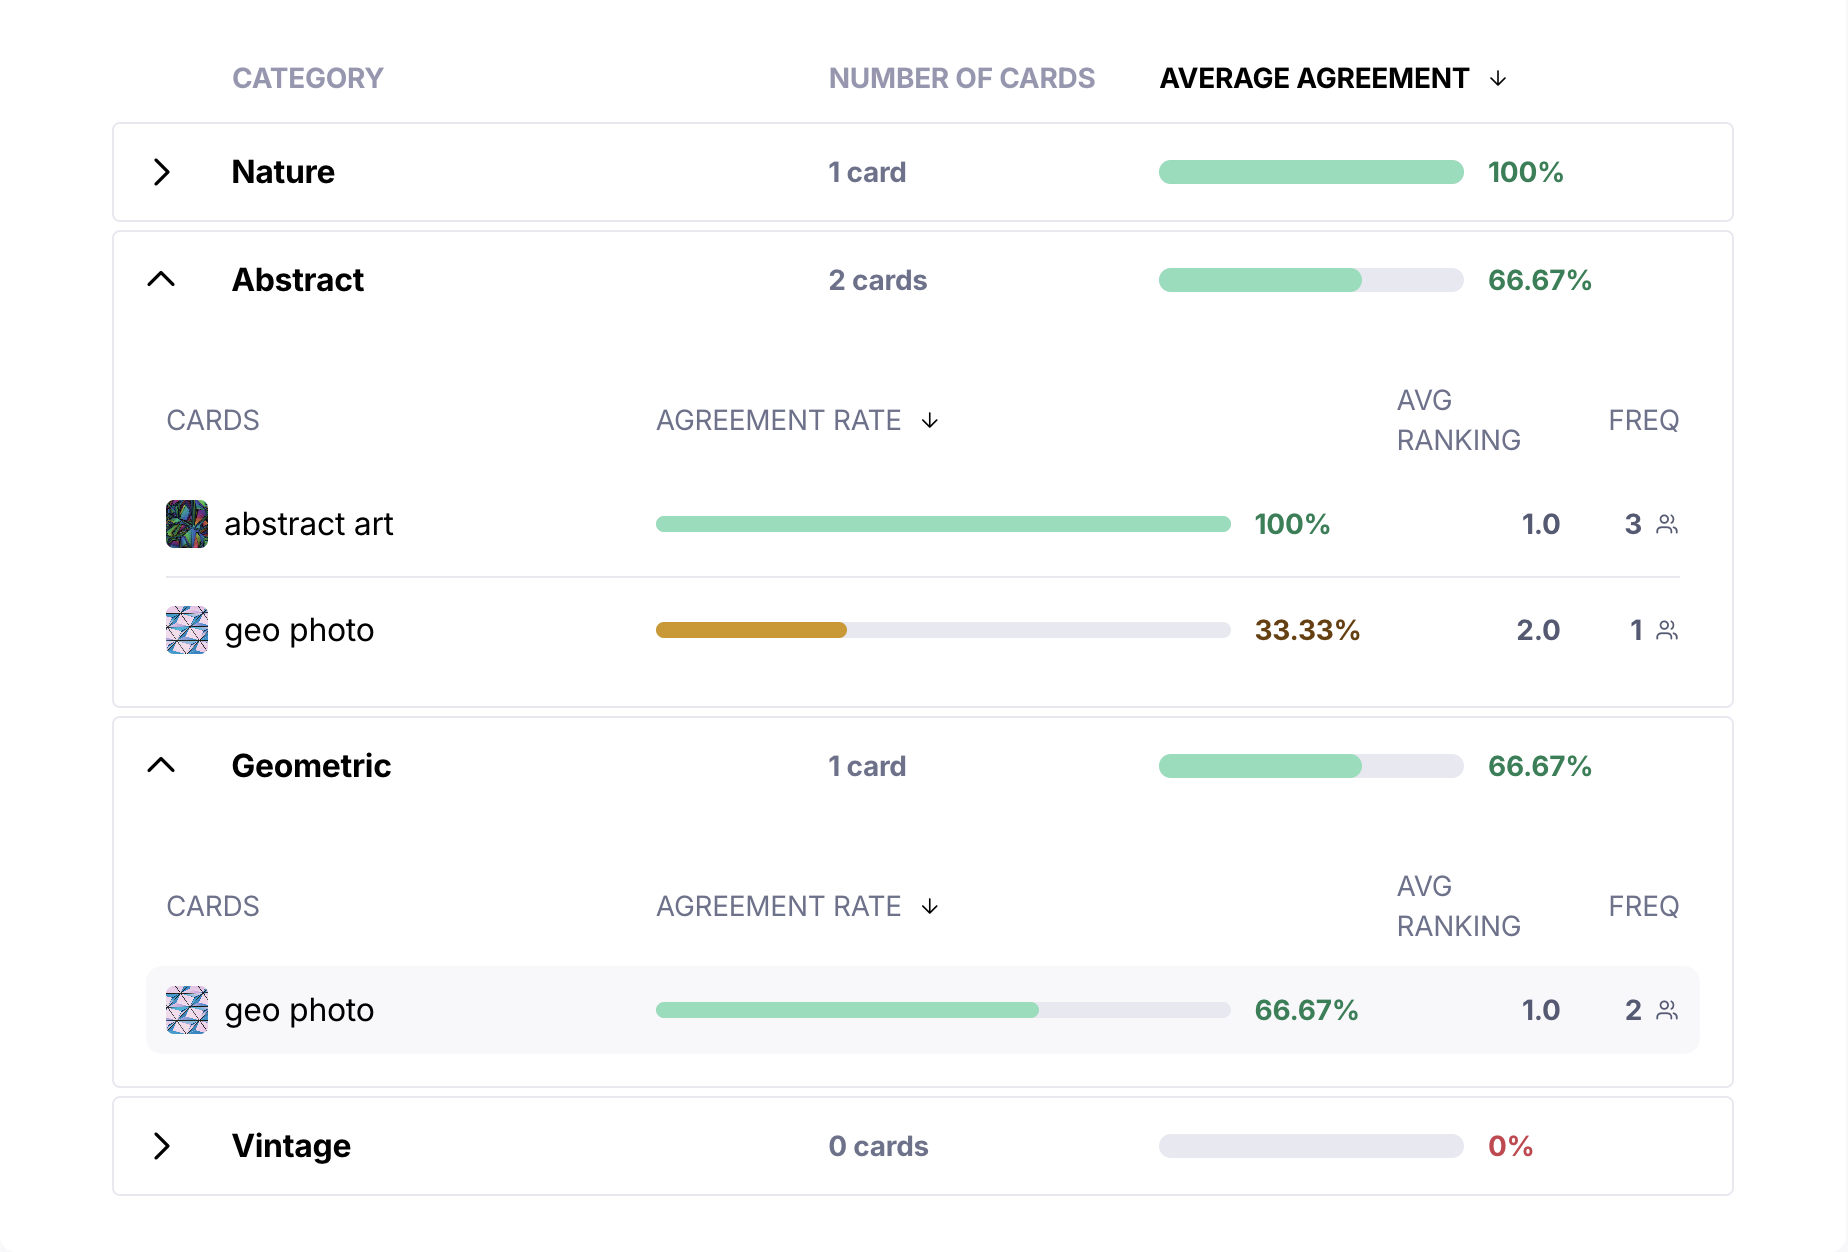
These results can also be helpful to identify labeling patterns. In the example screenshot below, we see that users created both "Abstract" and "Geometric" to categorize the same cards.
However, 66.67% of the testers (2 testers) opted for "Geometric". This may be an indicator that your users will prefer this label, though you might also want to ensure that the content is discoverable using both terms.
Category display options
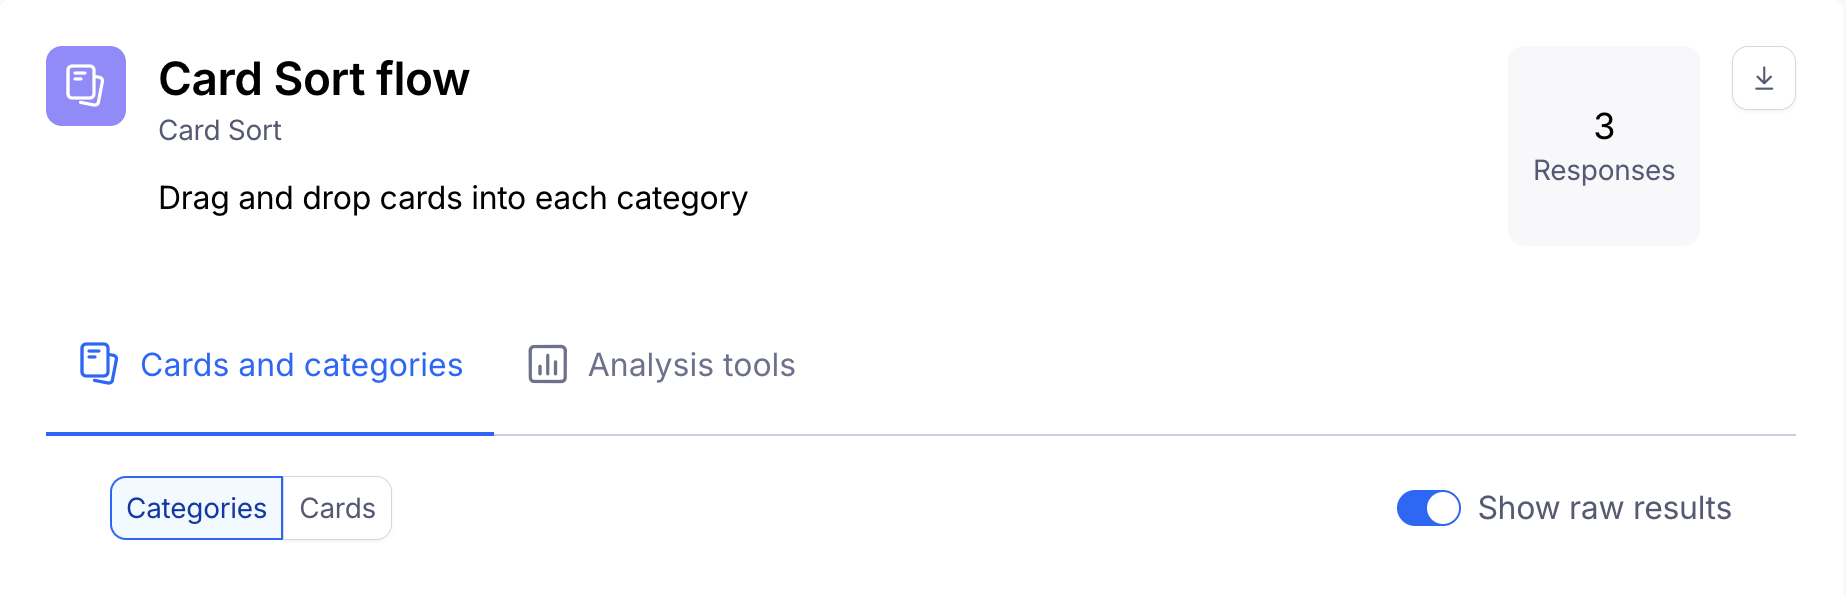
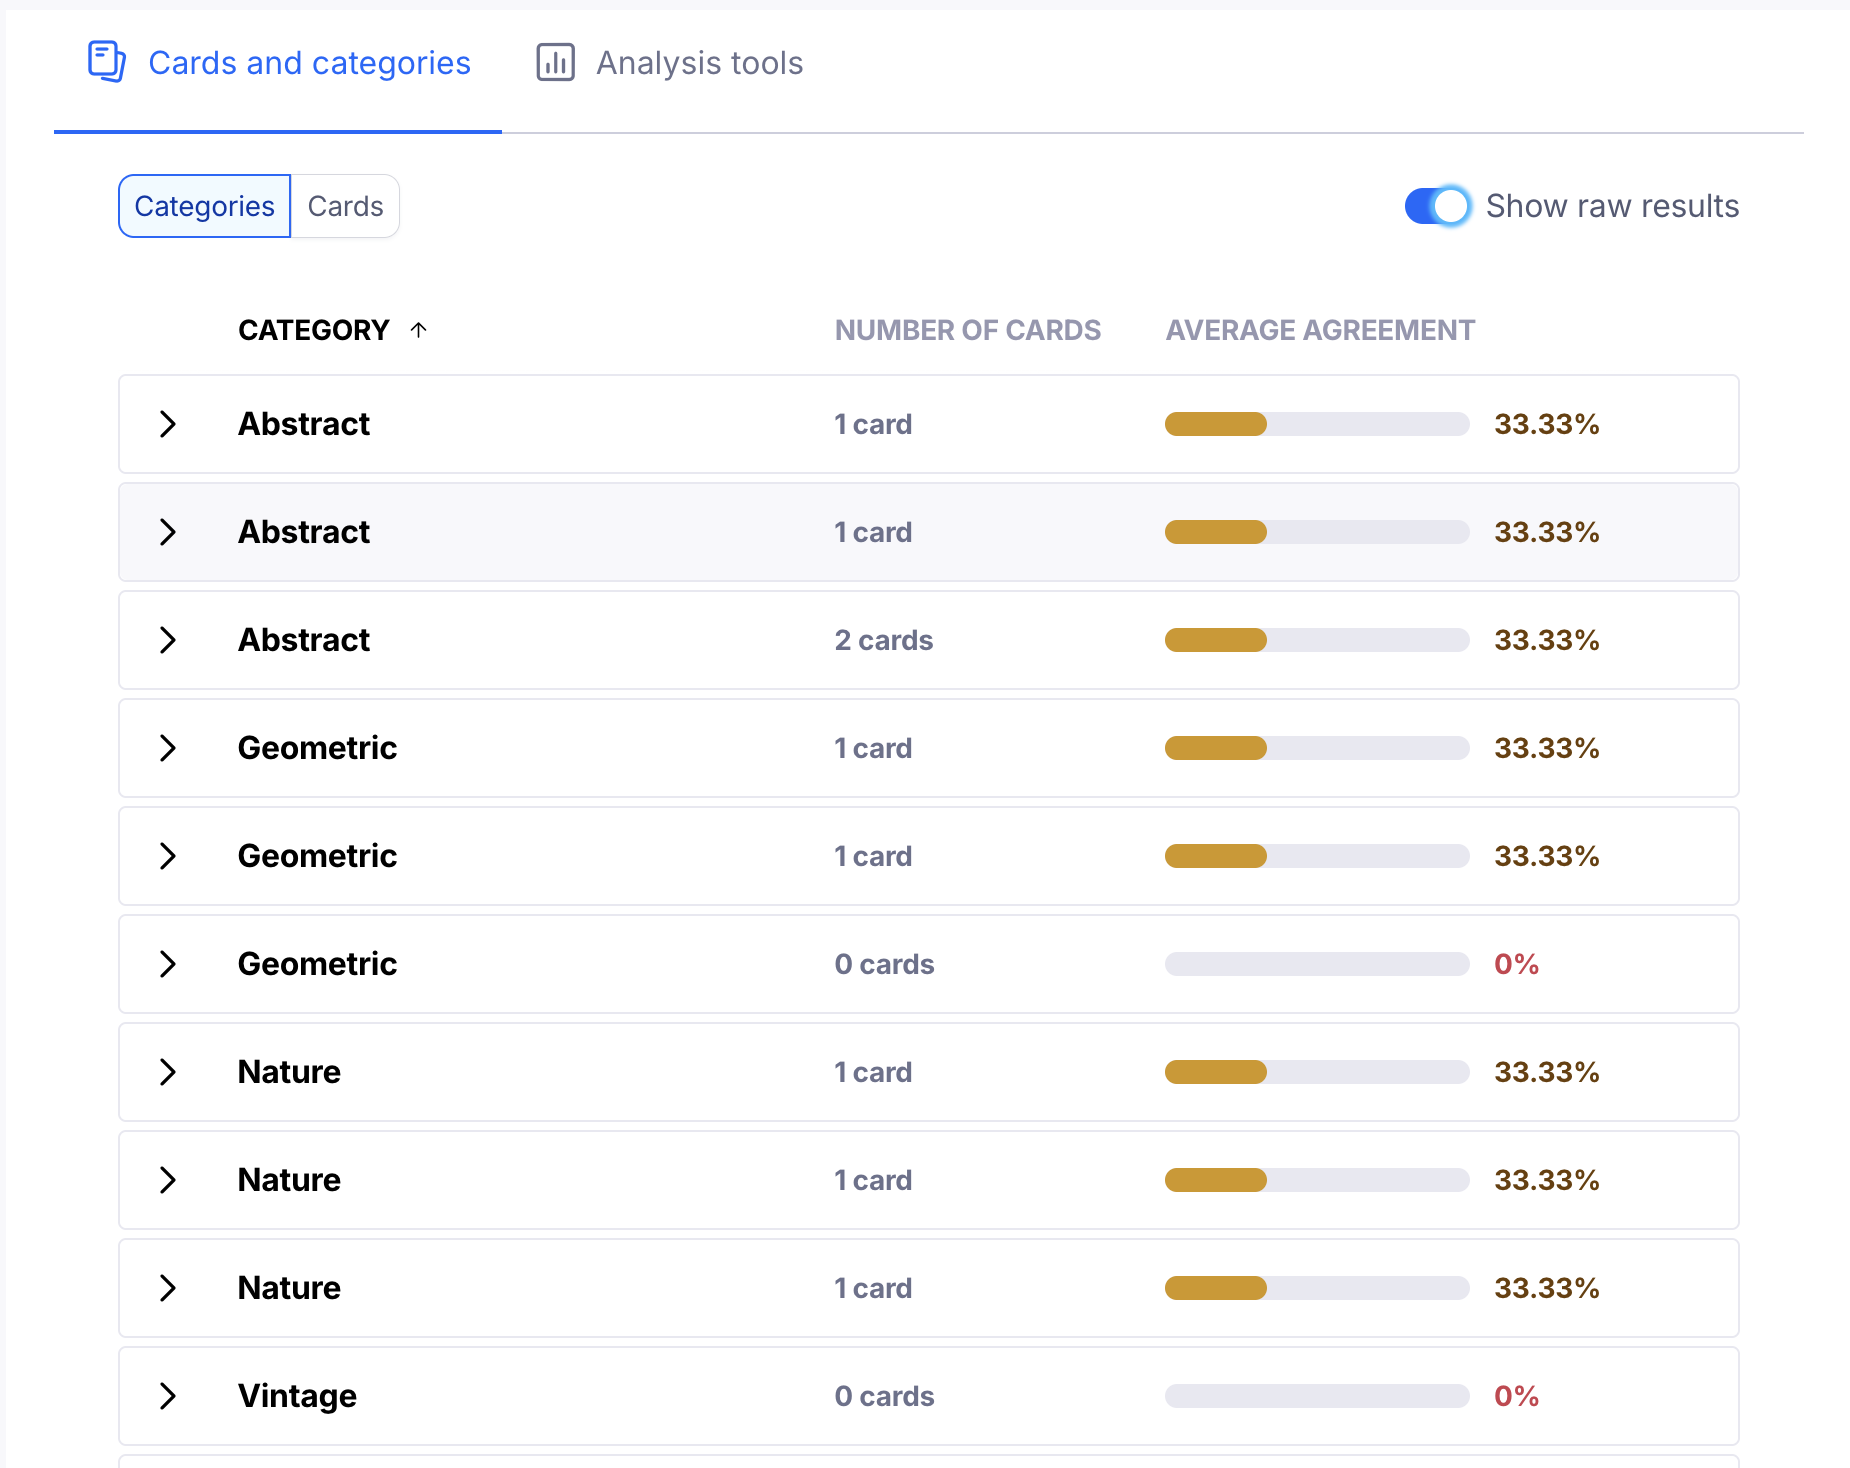
Show raw results: Displays the original results collected from the testers, without automatic grouping. For instance, if 3 testers have created a "Nature" category, this category will appear 3 times, each displaying the cards for each tester.
Your cards
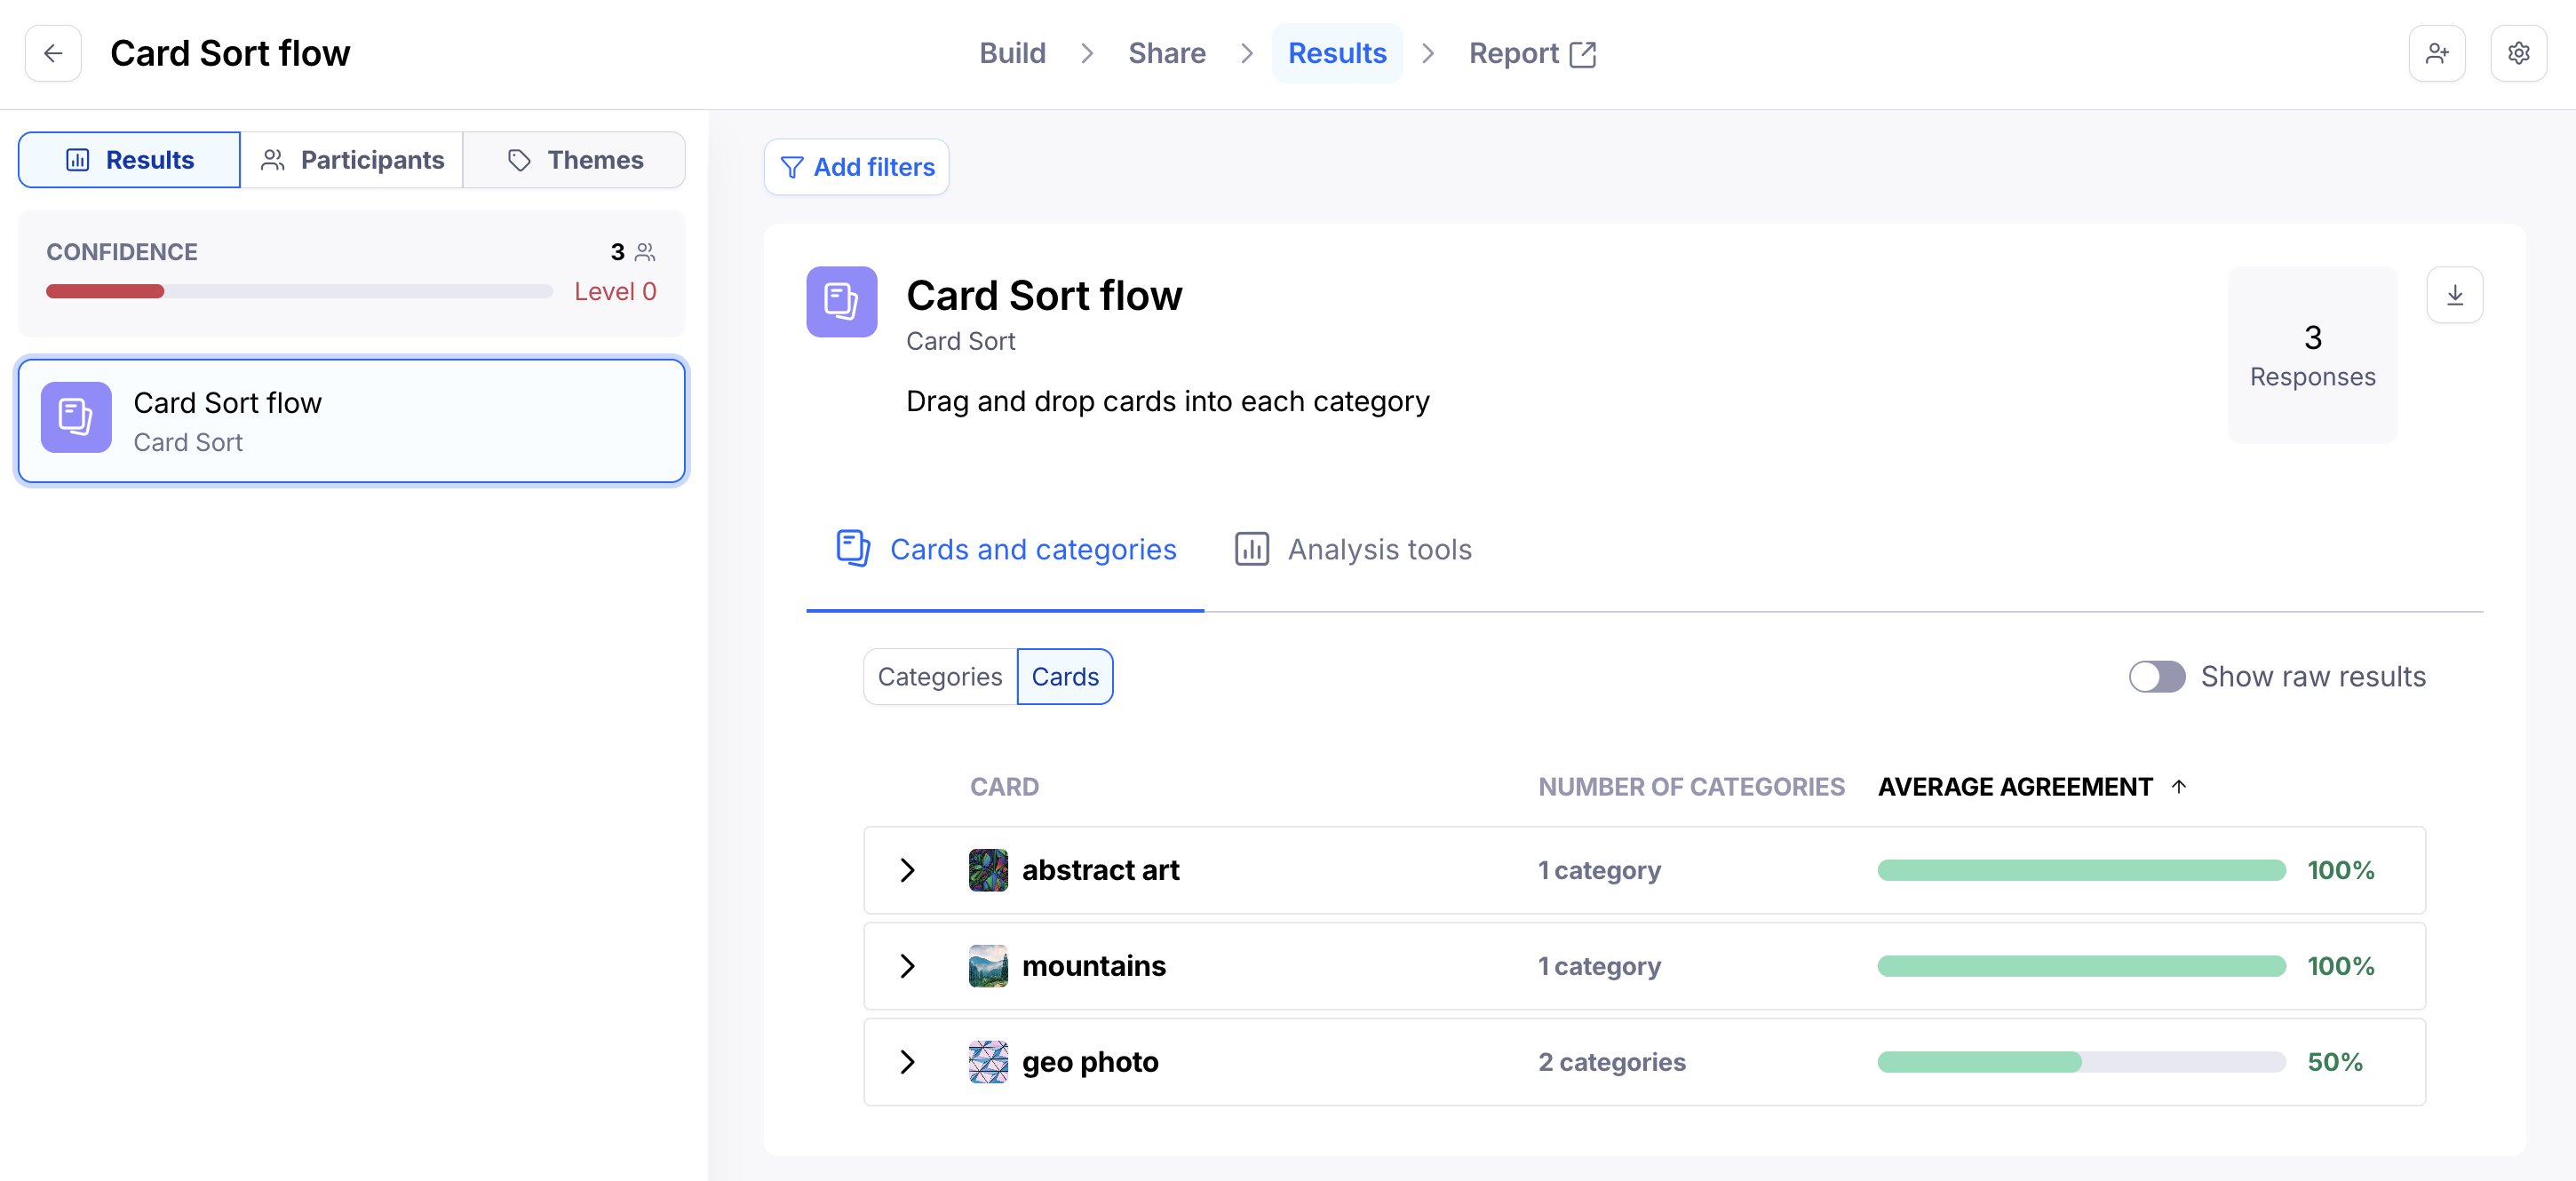
The Cards tab lists all cards used in the card sort block and their respective average agreement. It allows you to dig further into the trends you were able to identify in the Categories tab.
To identify the cards with the most and least consensus, sort by the number of categories. Cards that have been placed in only a few categories indicate stronger consensus. On the other hand, cards that have been scattered across many categories may suggest you need to research further — for instance, to understand whether the wording is ambiguous, or the card is too generic.
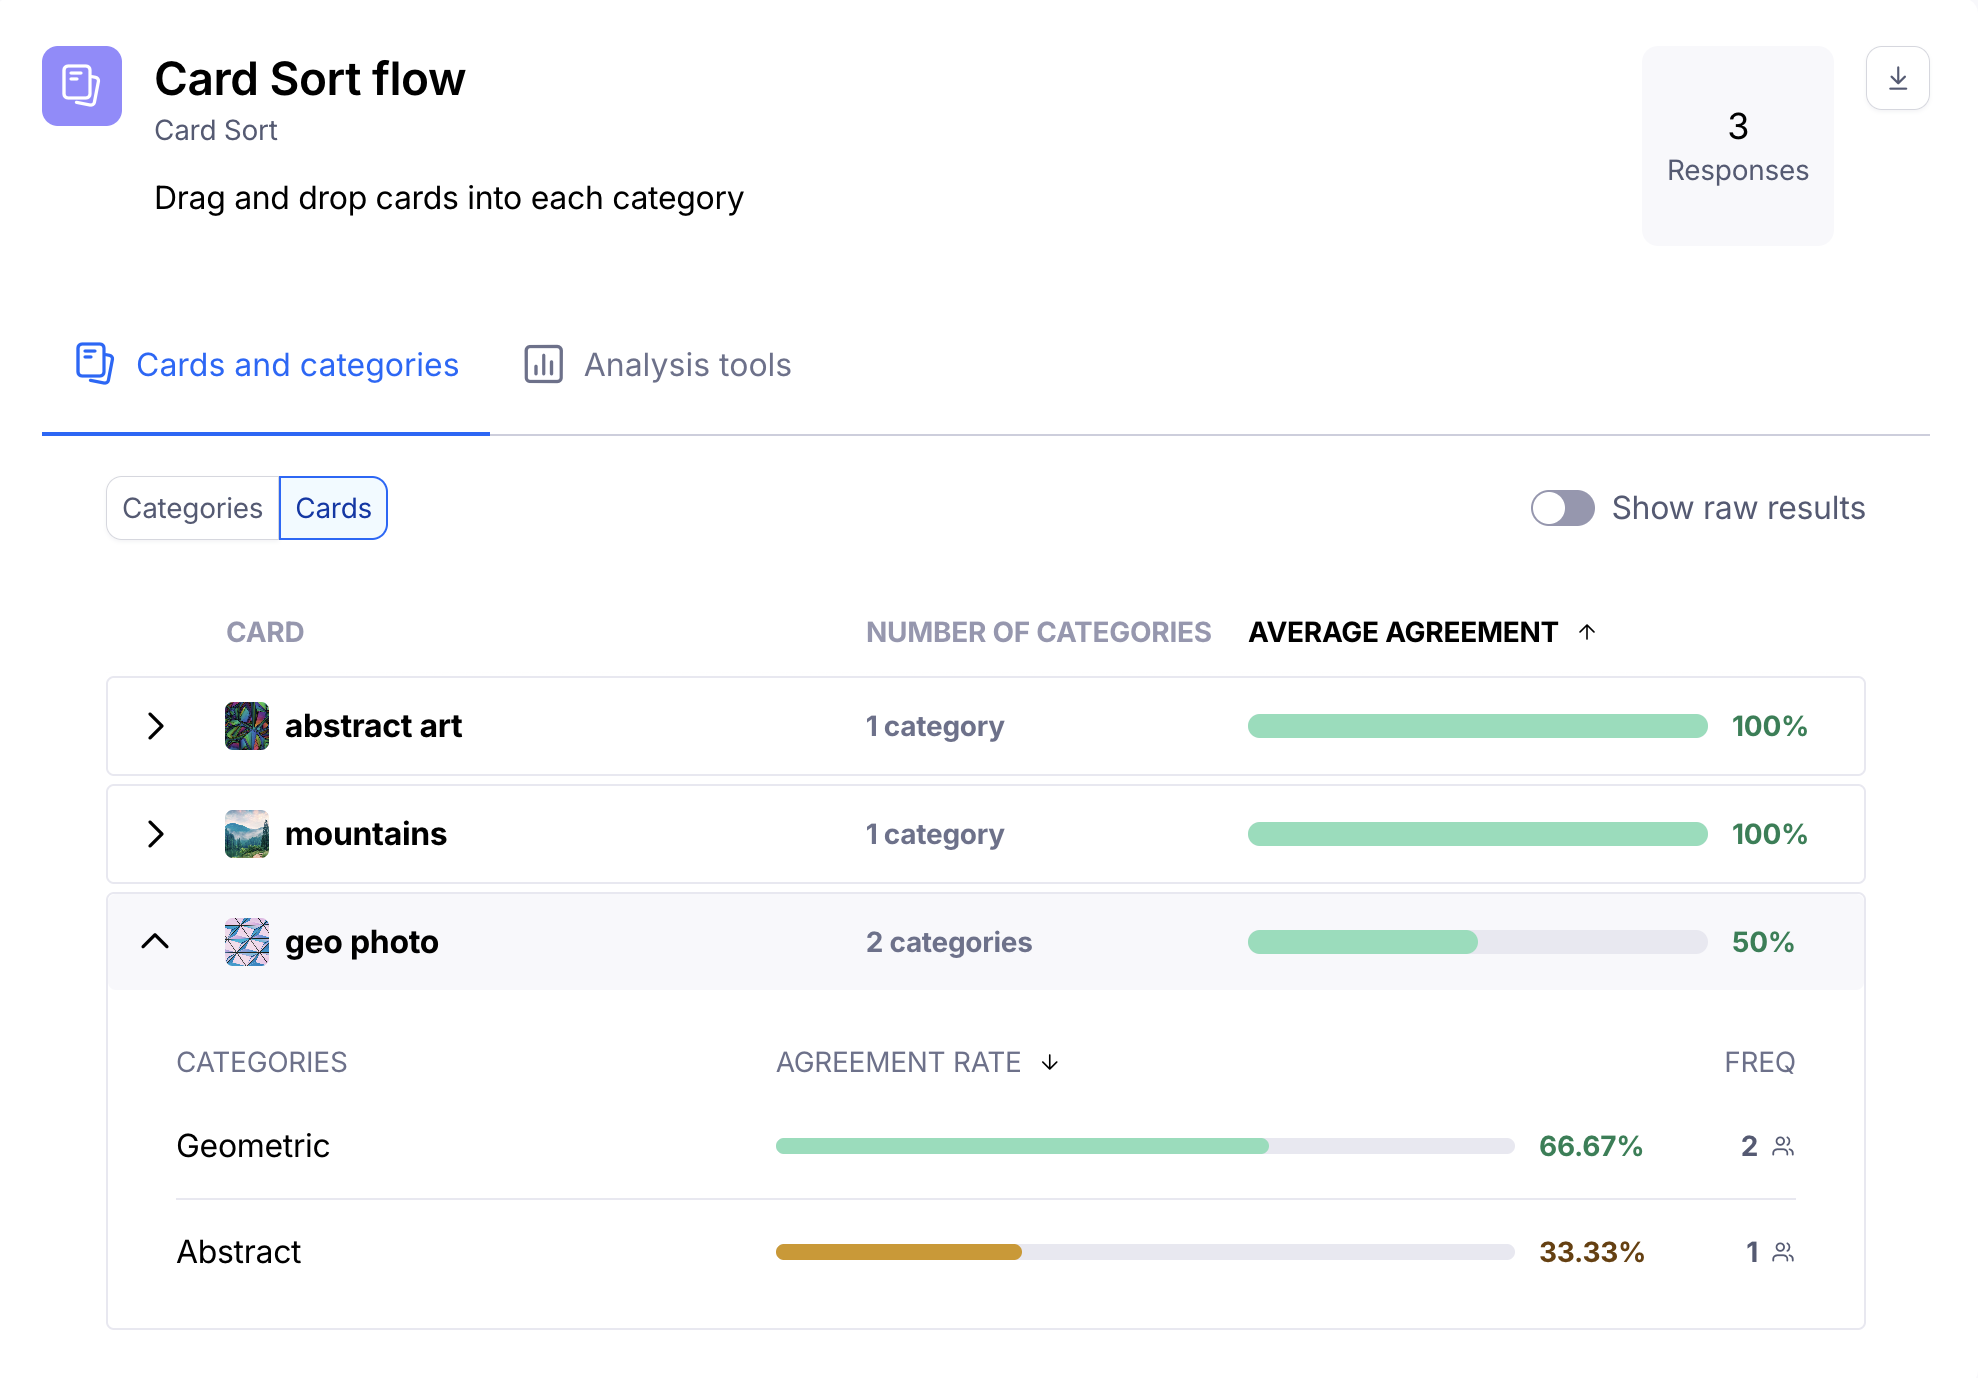
If you expand each card, you'll see the categories it has been sorted into, the agreement rate for each of those categories, and how many people sorted the card into that category.
This can help you make informed decisions. In the example screenshot below, we see that "geo photo" has, on the surface, a low agreement rate. However, we can also see that more than 60% of the testers identified that card as "Geometric".
Analysis tools
Agreement matrix
The agreement matrix groups cards under each category based on their highest agreement rates. It gives you a visual representation of how often cards appeared in each category. Learn more
Similarity matrix
The similarity matrix evaluates the relationship between pairs of cards. It gives you insight into which cards were most frequently grouped together. Learn more