[Prototype test] Creating a first-click test
Last updated: June 25, 2026
First-click testing, where you upload an image and track where participants would click first to complete a given task, isn’t directly supported in Maze at the moment.
This article shows a workaround using a prototype block and a two-screen prototype. The test ends right after the first click, no matter where the click is. This is needed because each mission on Maze must have at least one defined path with at least two screens. It is only considered complete once a tester reaches the end screen of the path.
Set up your design file
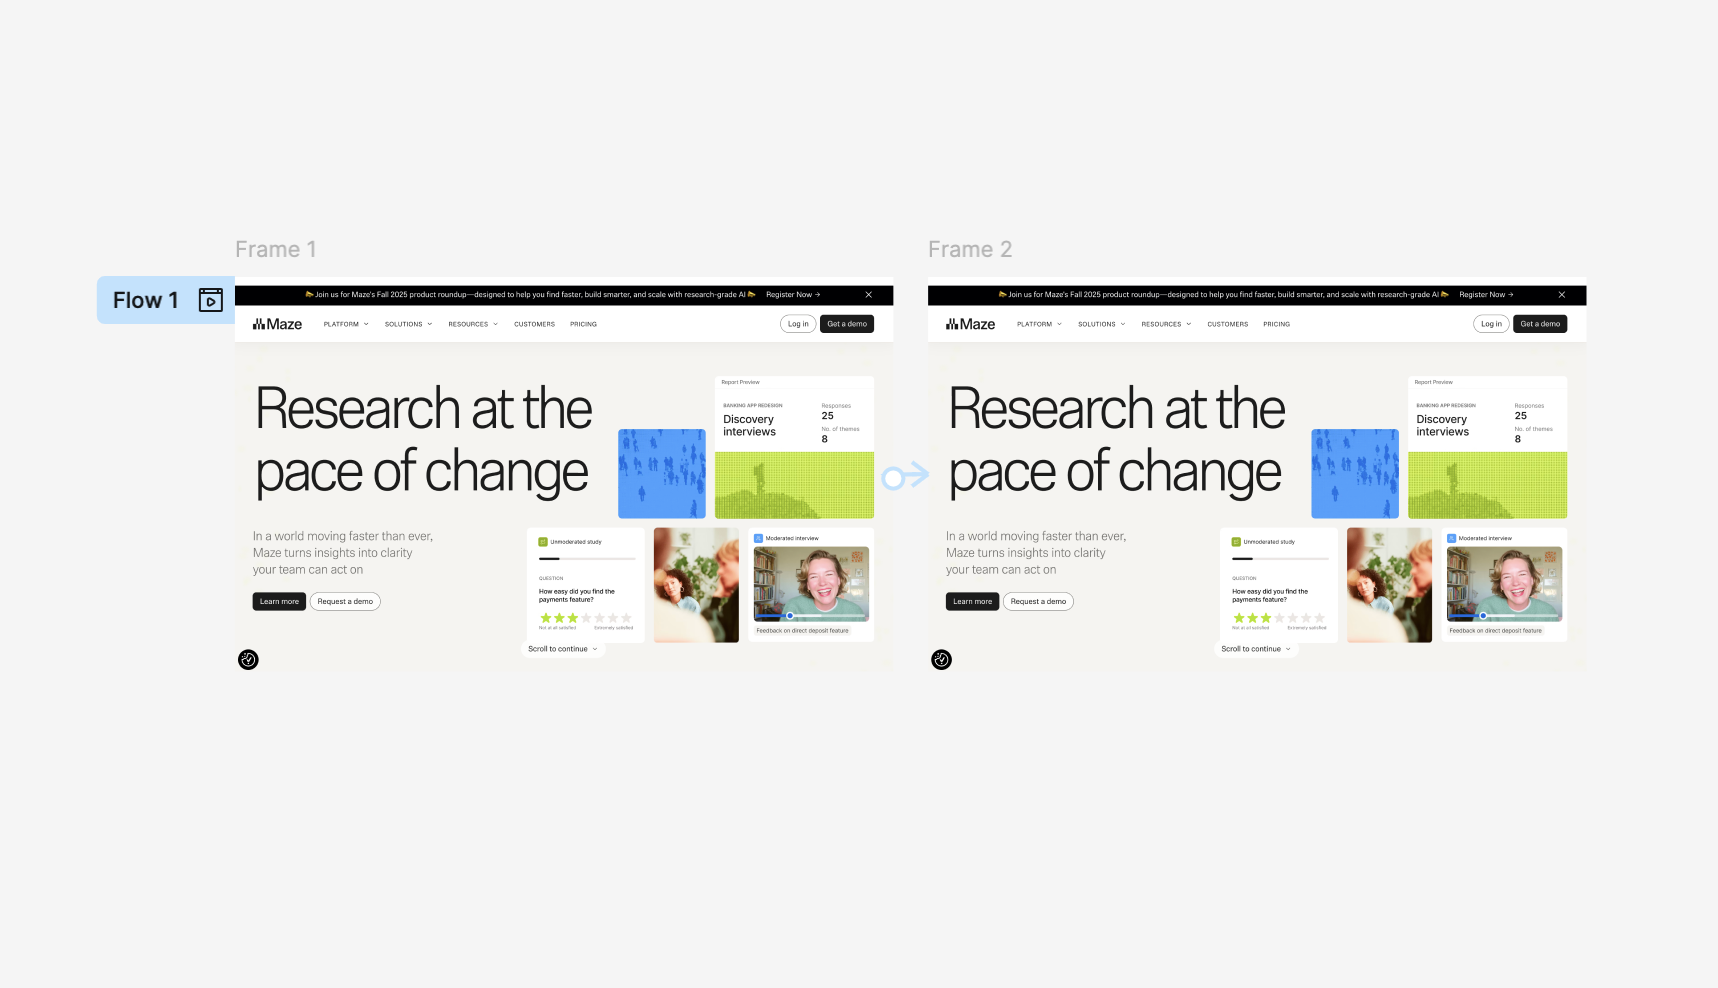
In the design file, duplicate the screen you want to test. Use a single hotspot connecting the first and the second screens.
The test screen doesn’t have to be too complex. It can be a frame from your design file, a screenshot, or even a wireframe or sketch. This allows you to test design choices throughout your development cycle.
Set up a first-click test in Maze
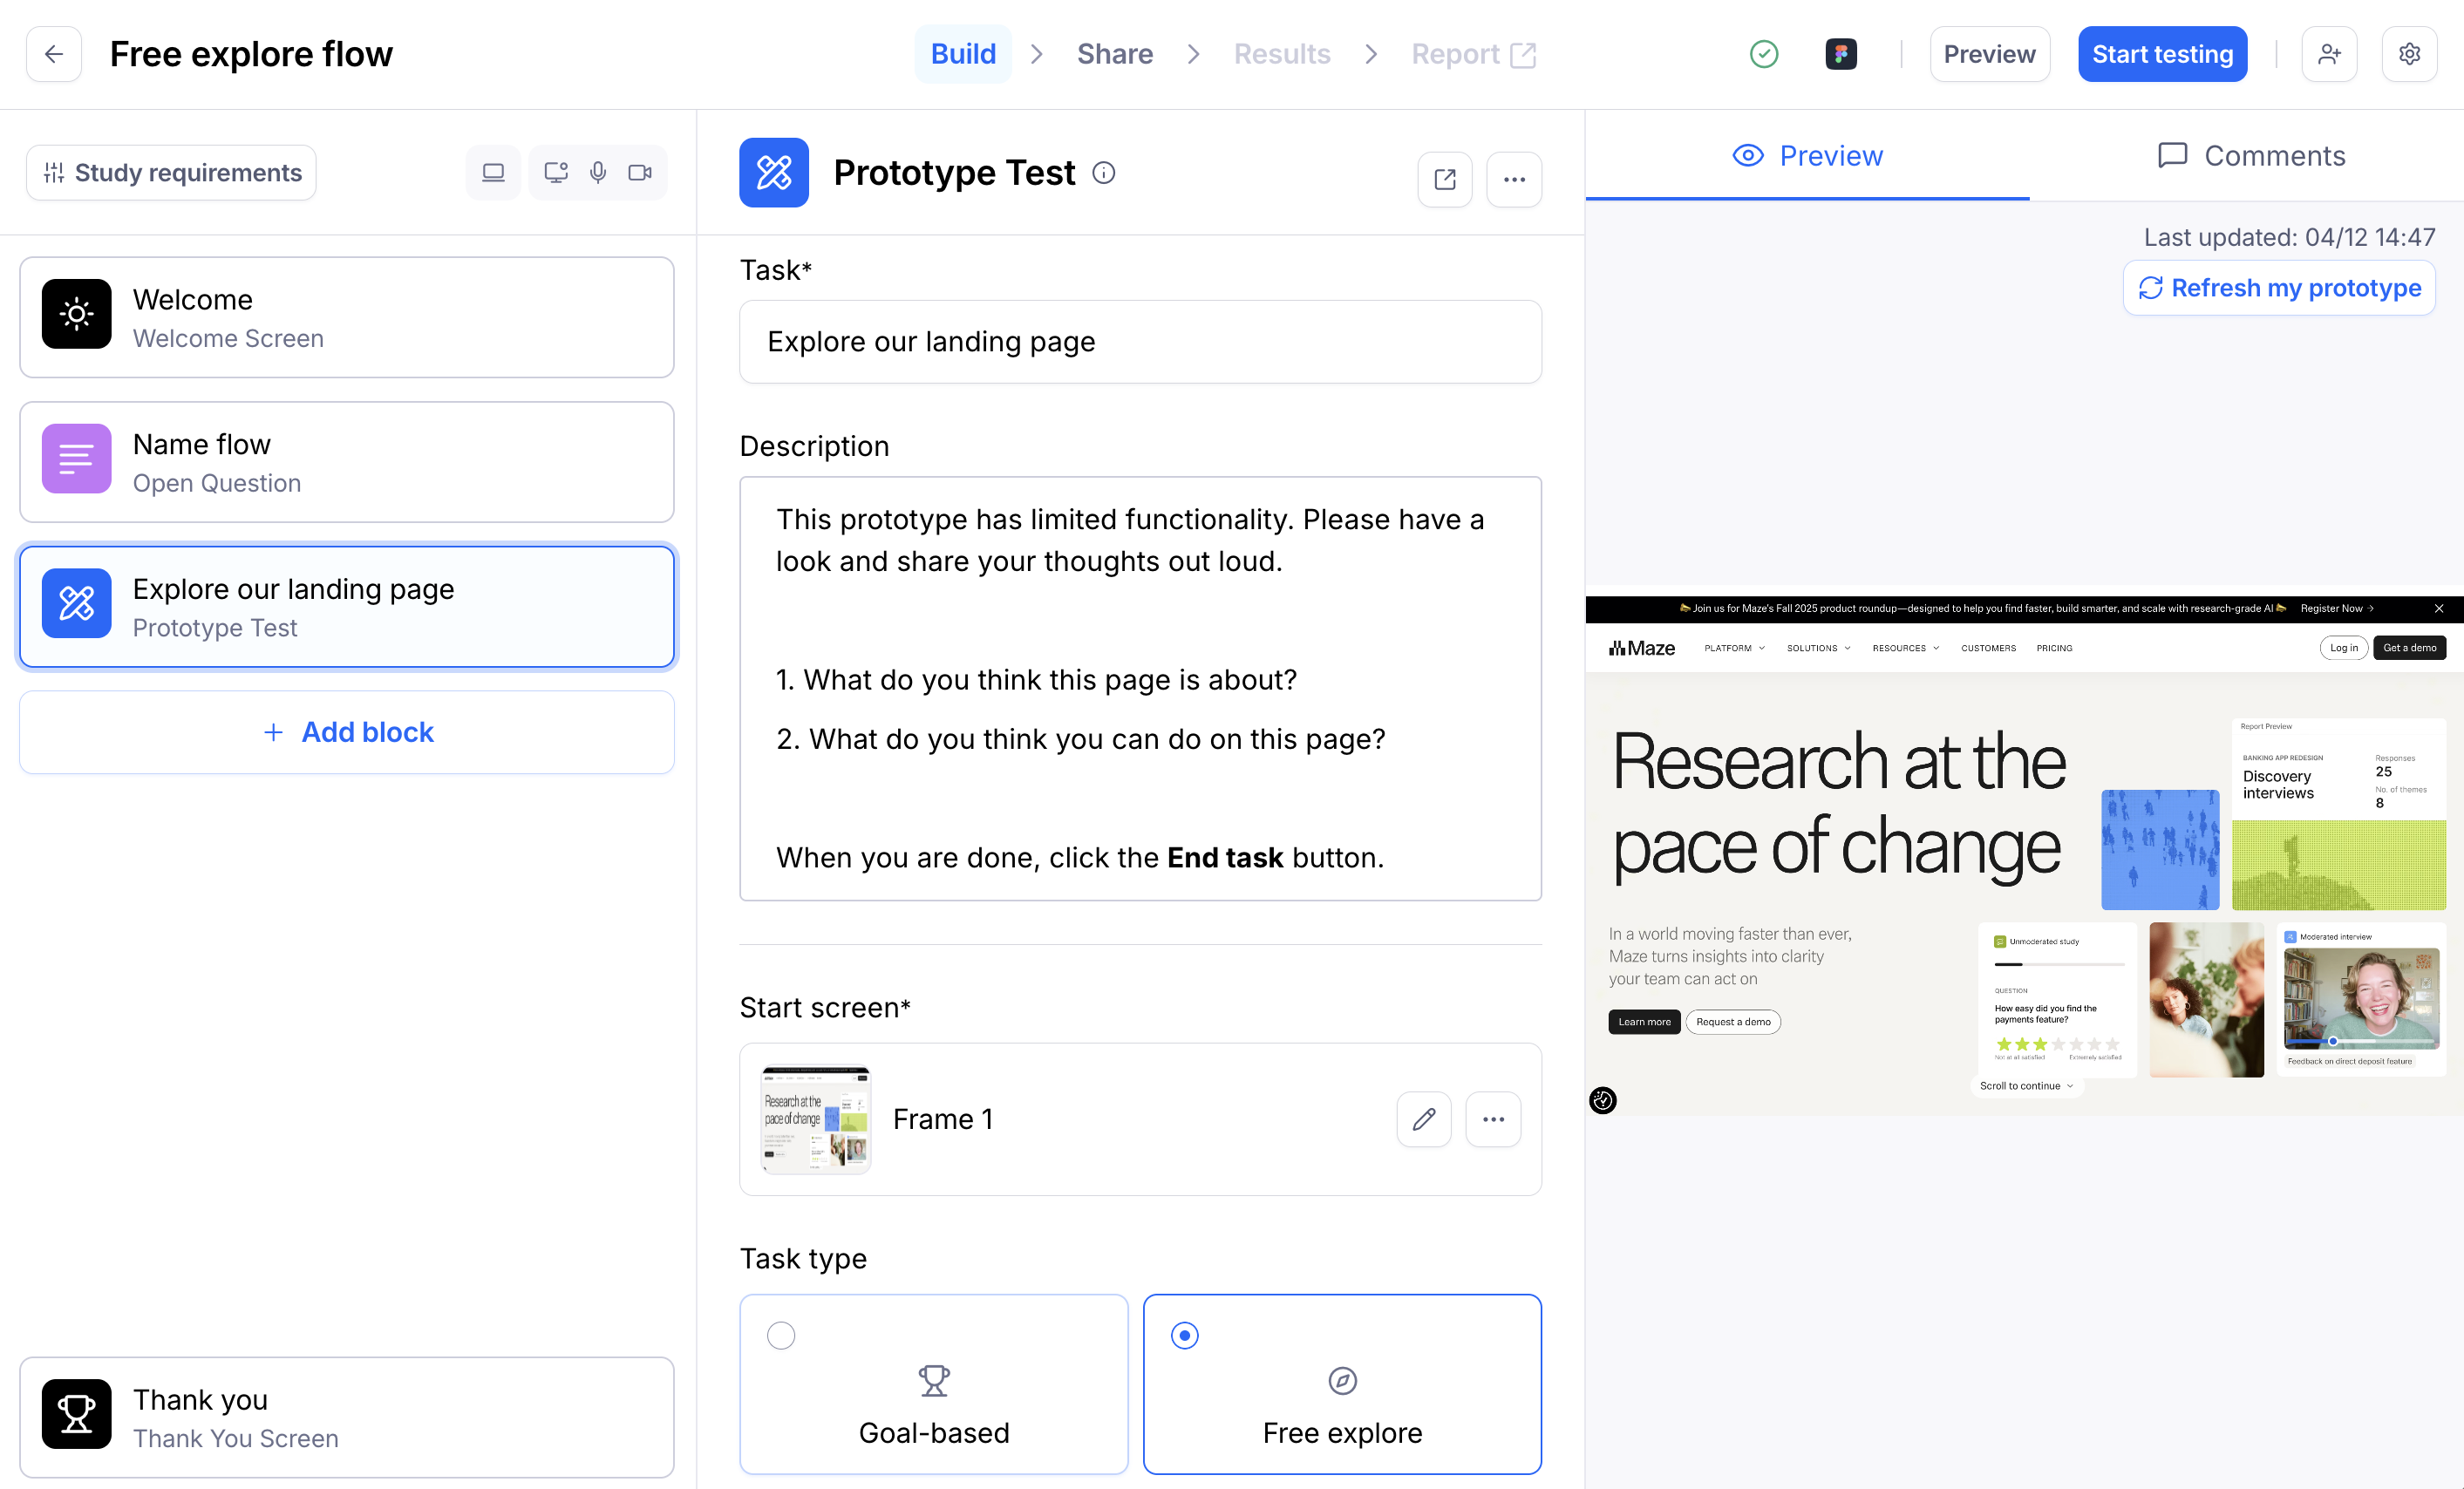
Add a prototype test block, and import your prototype. You can also set up a prototype test inside a variant comparison block.
Write down the situation to be presented to your users. You can also add a context screen for added clarity.
Under ‘Task type’, select Free explore.
Since you’ll get limited quantitative results for this task, we recommend you enable Clips to record participants’ thoughts and actions during the test.
Optionally, include any follow-up questions you want to ask your testers about the screen they just saw (using, for example, an opinion scale or a question block).
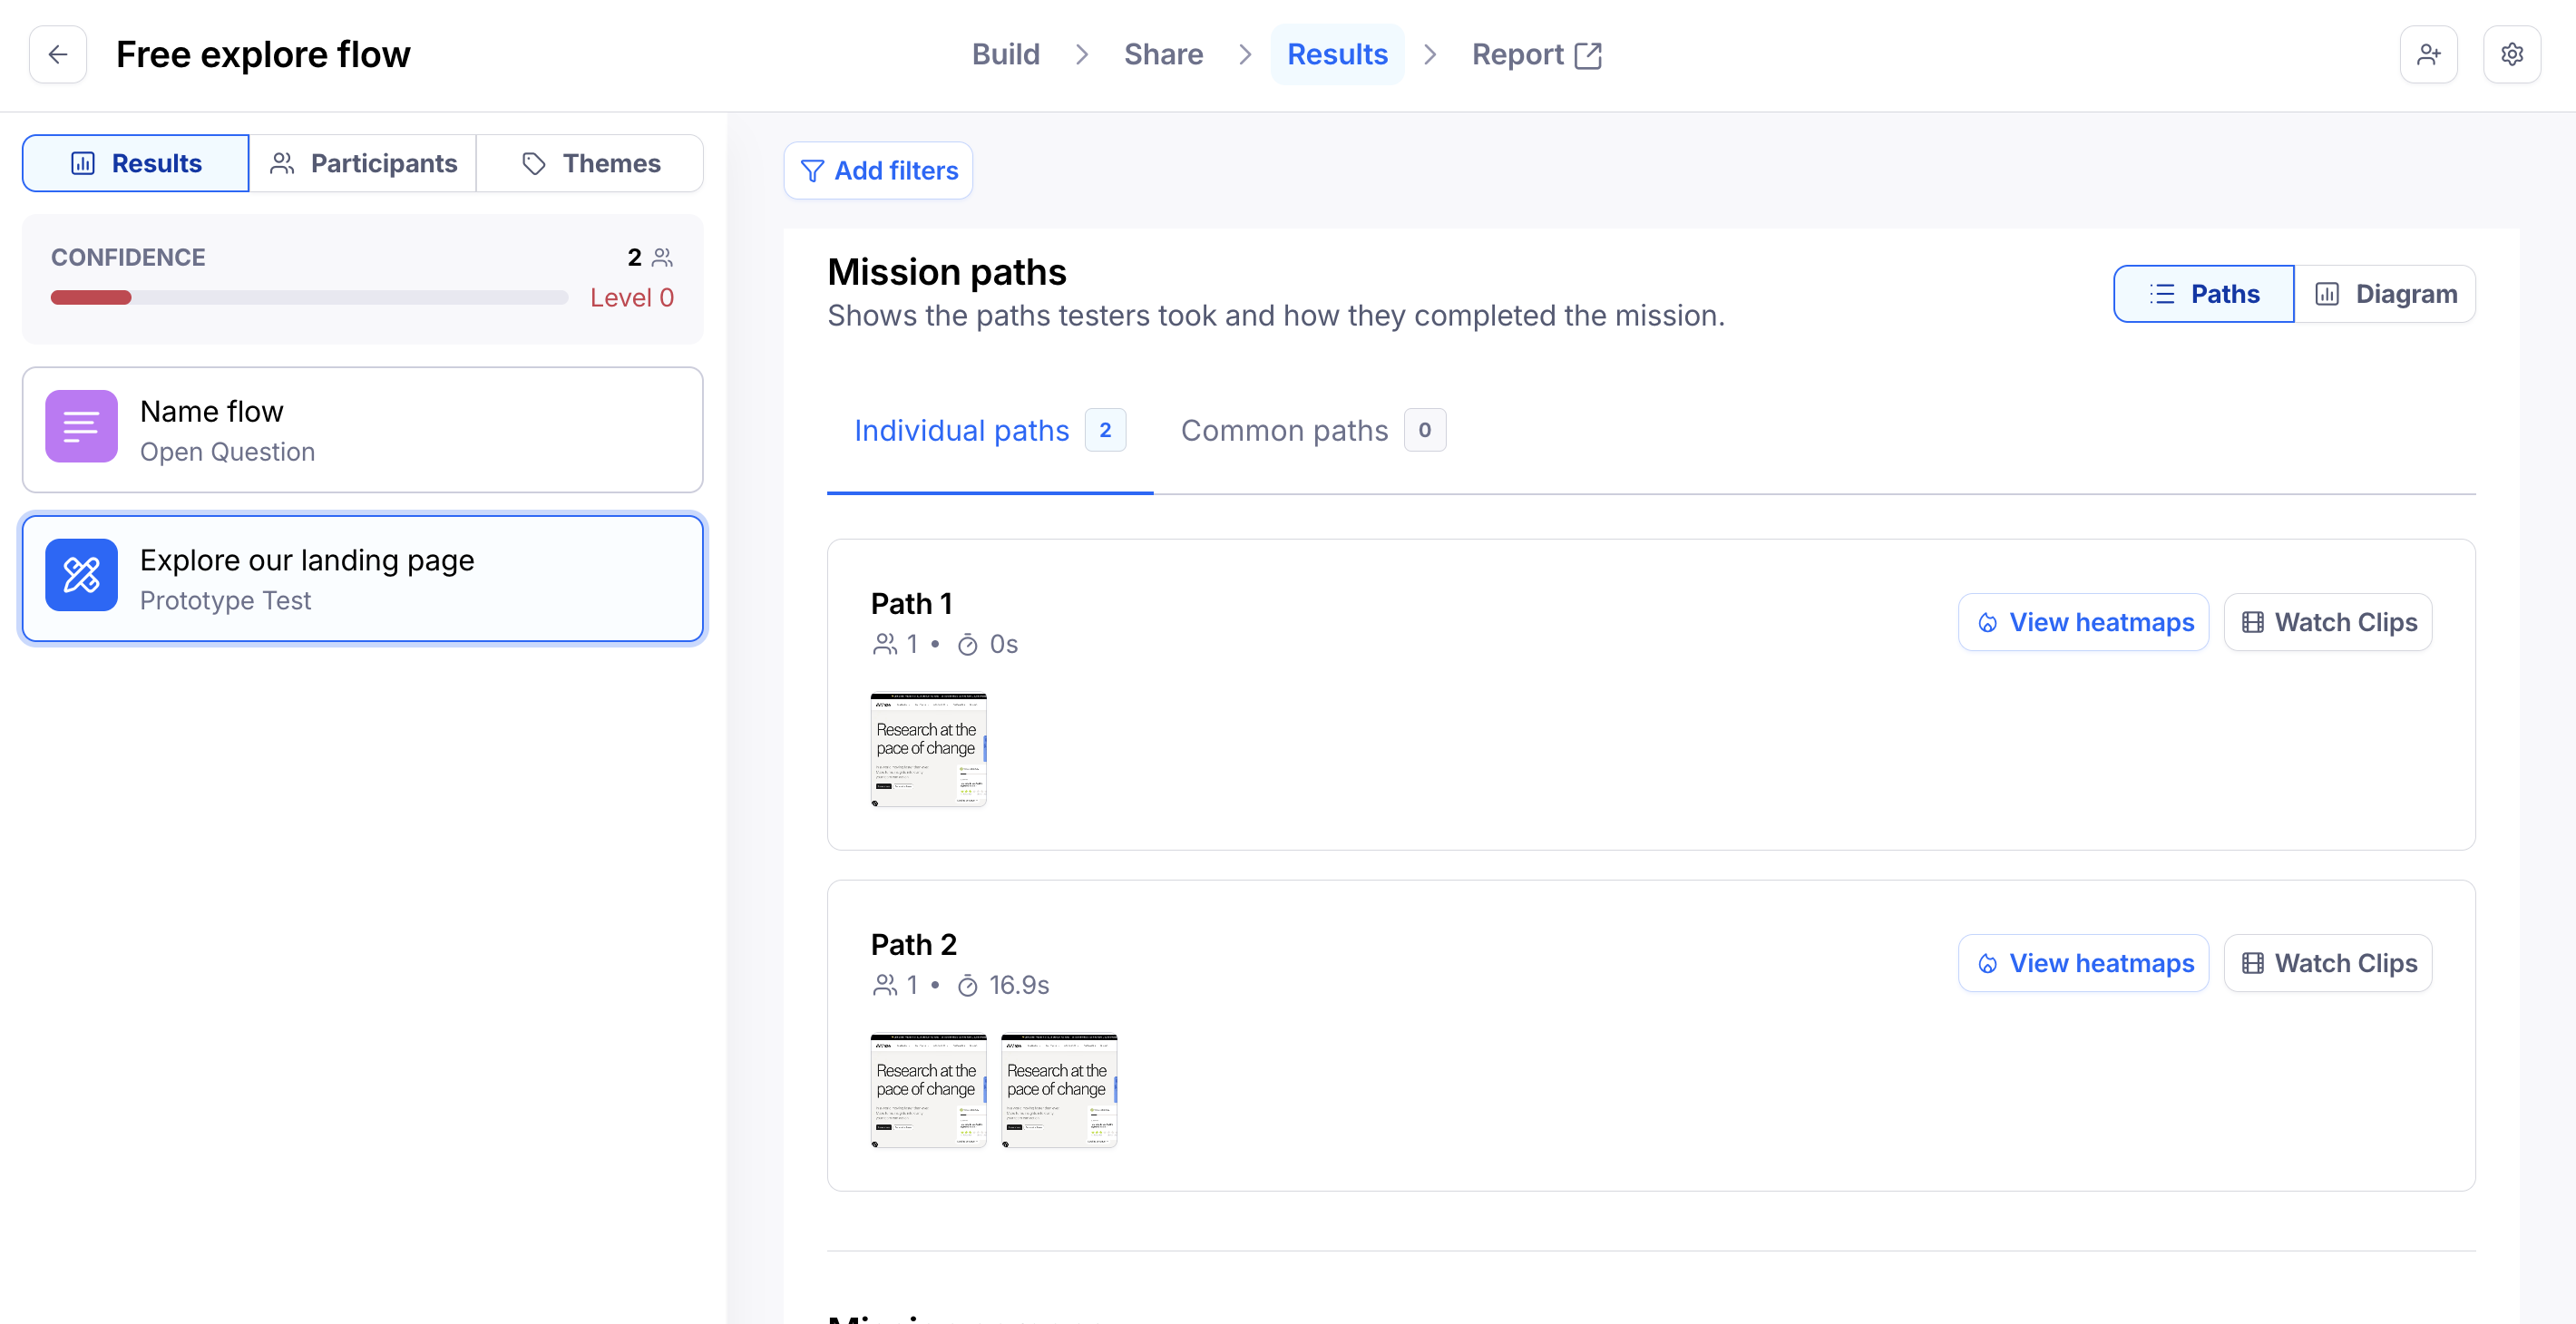
Analyze your results
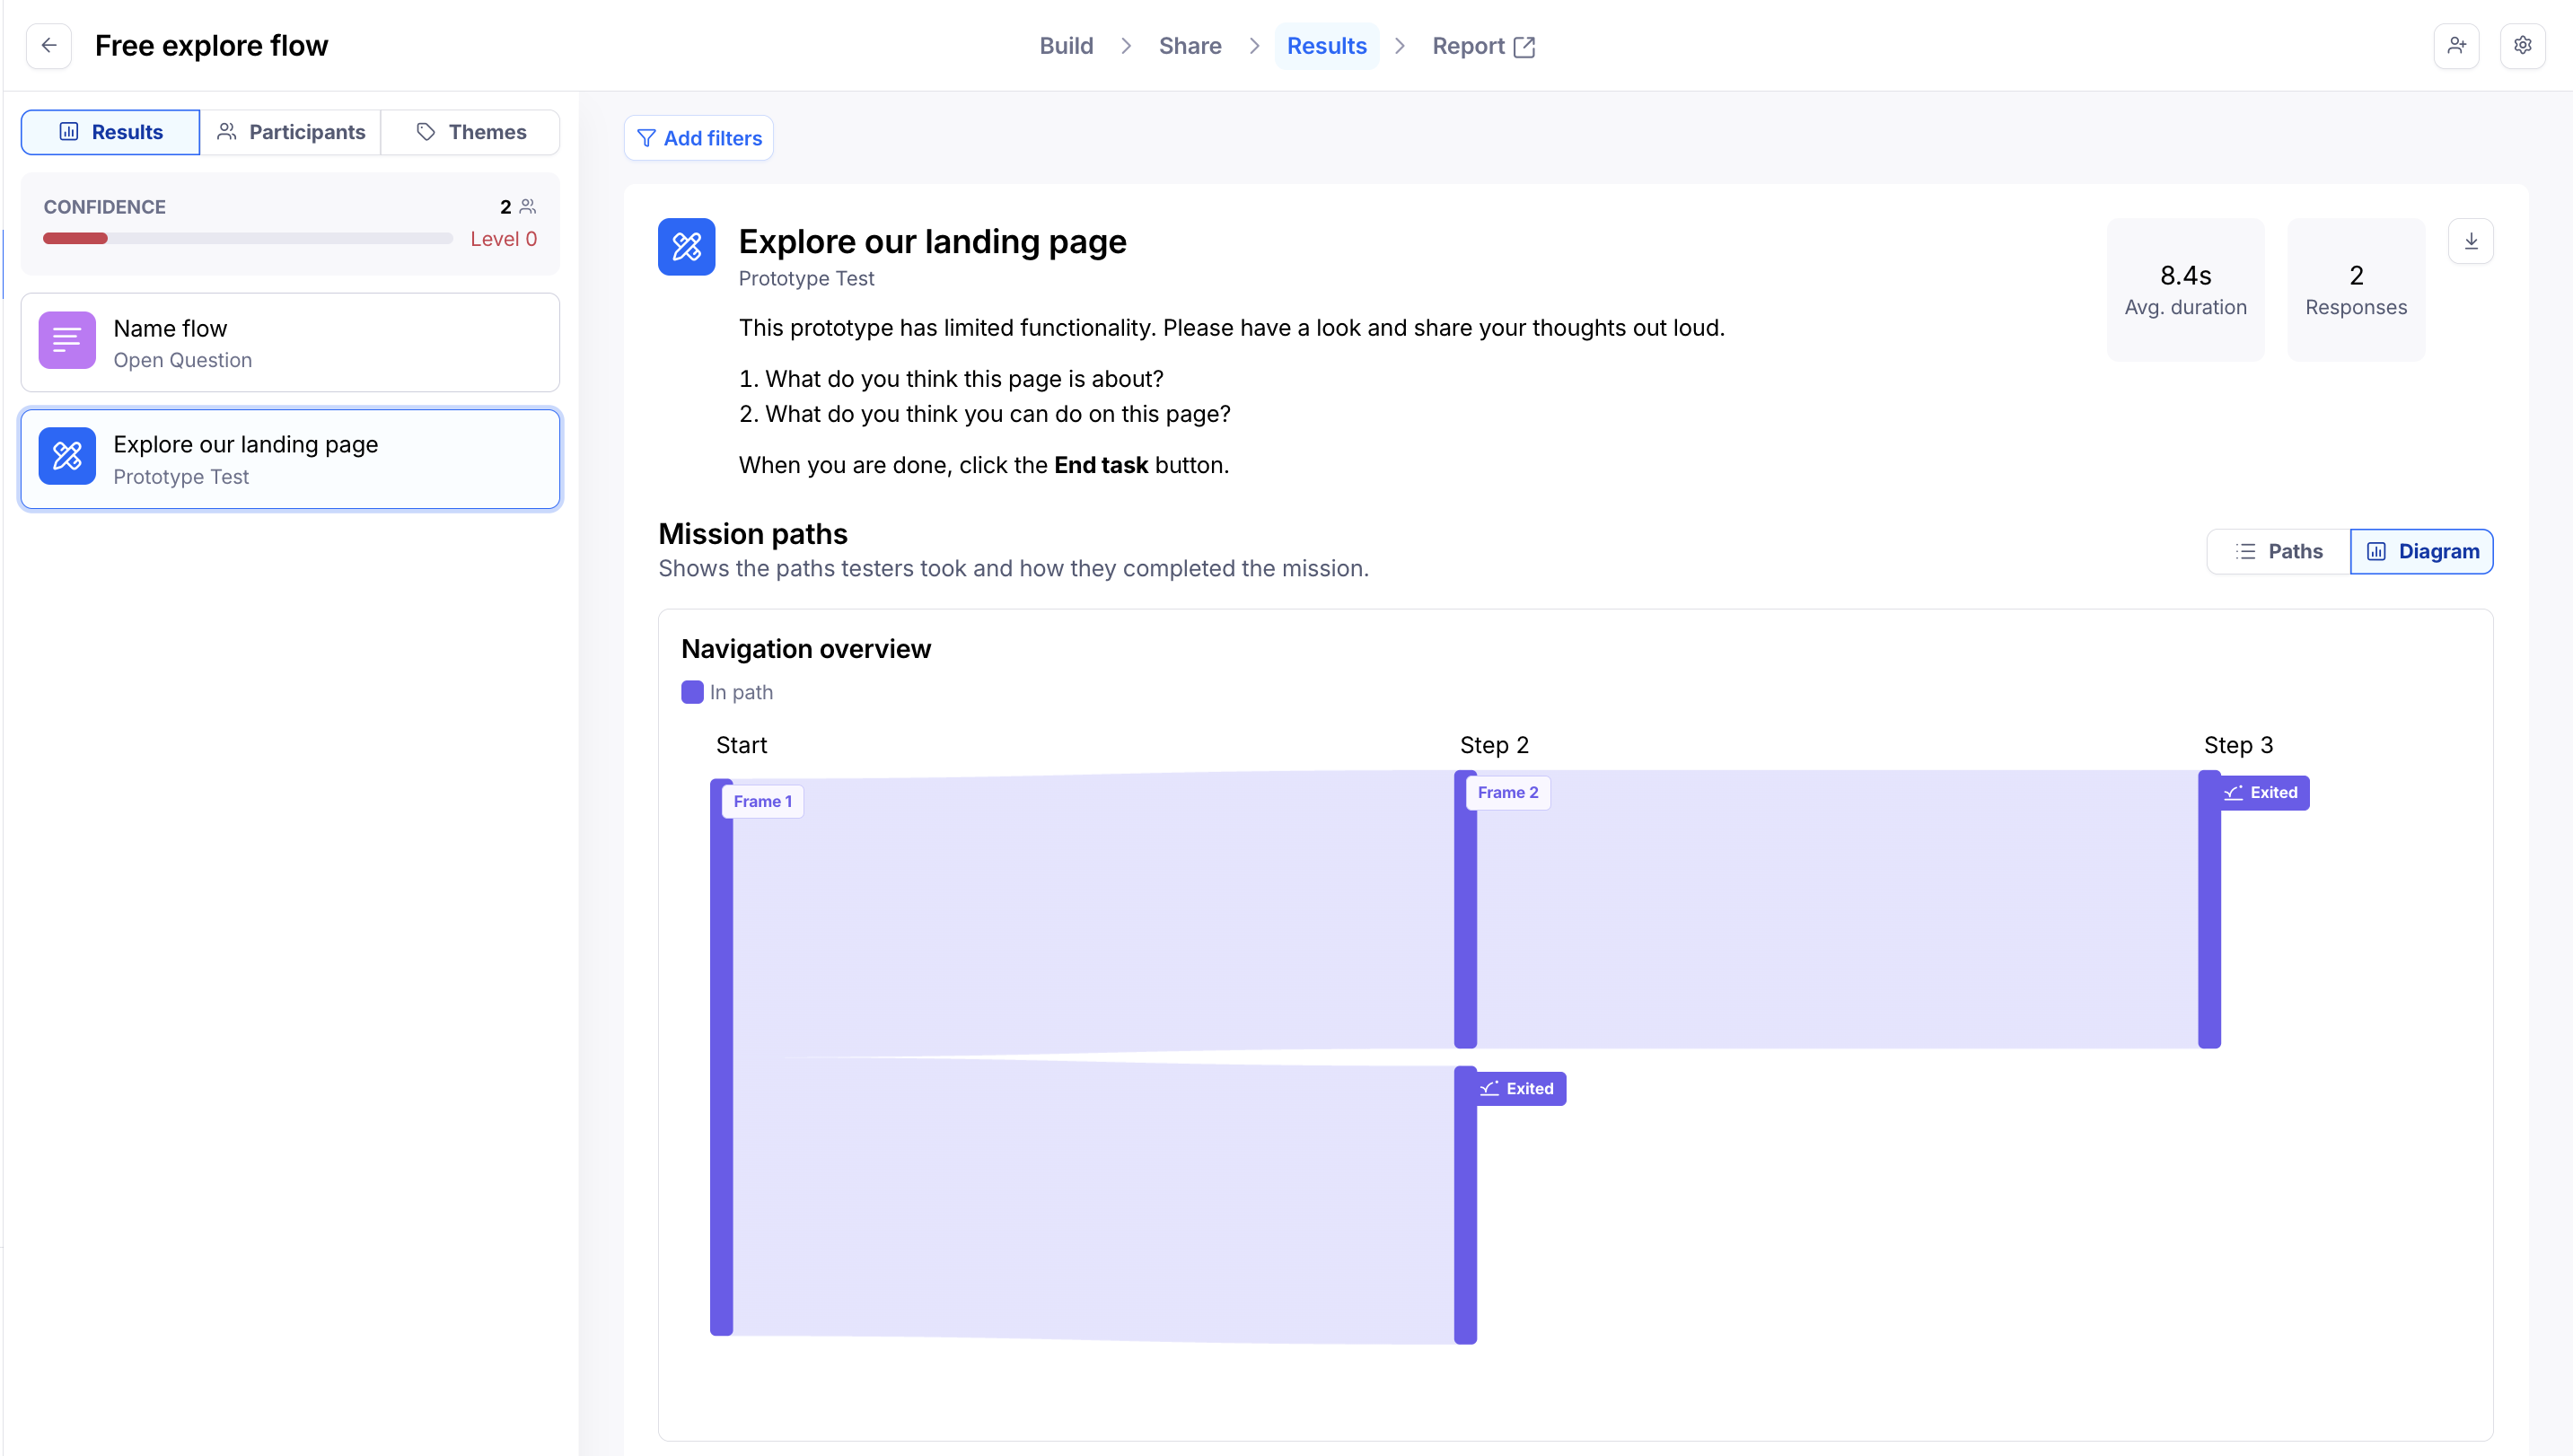
Results allow you to get qualitative insights into your participants’ flow through the prototype. You’ll be able to see information on common paths, heatmaps, click data, as well as Clips recordings (if enabled).
Because free explore tests don’t have predefined success criteria, the results won’t include metrics such as success rate, misclicks, and usability score. Likewise, it’s also not possible to apply filters.
Quantitative results: Heatmap & time spent
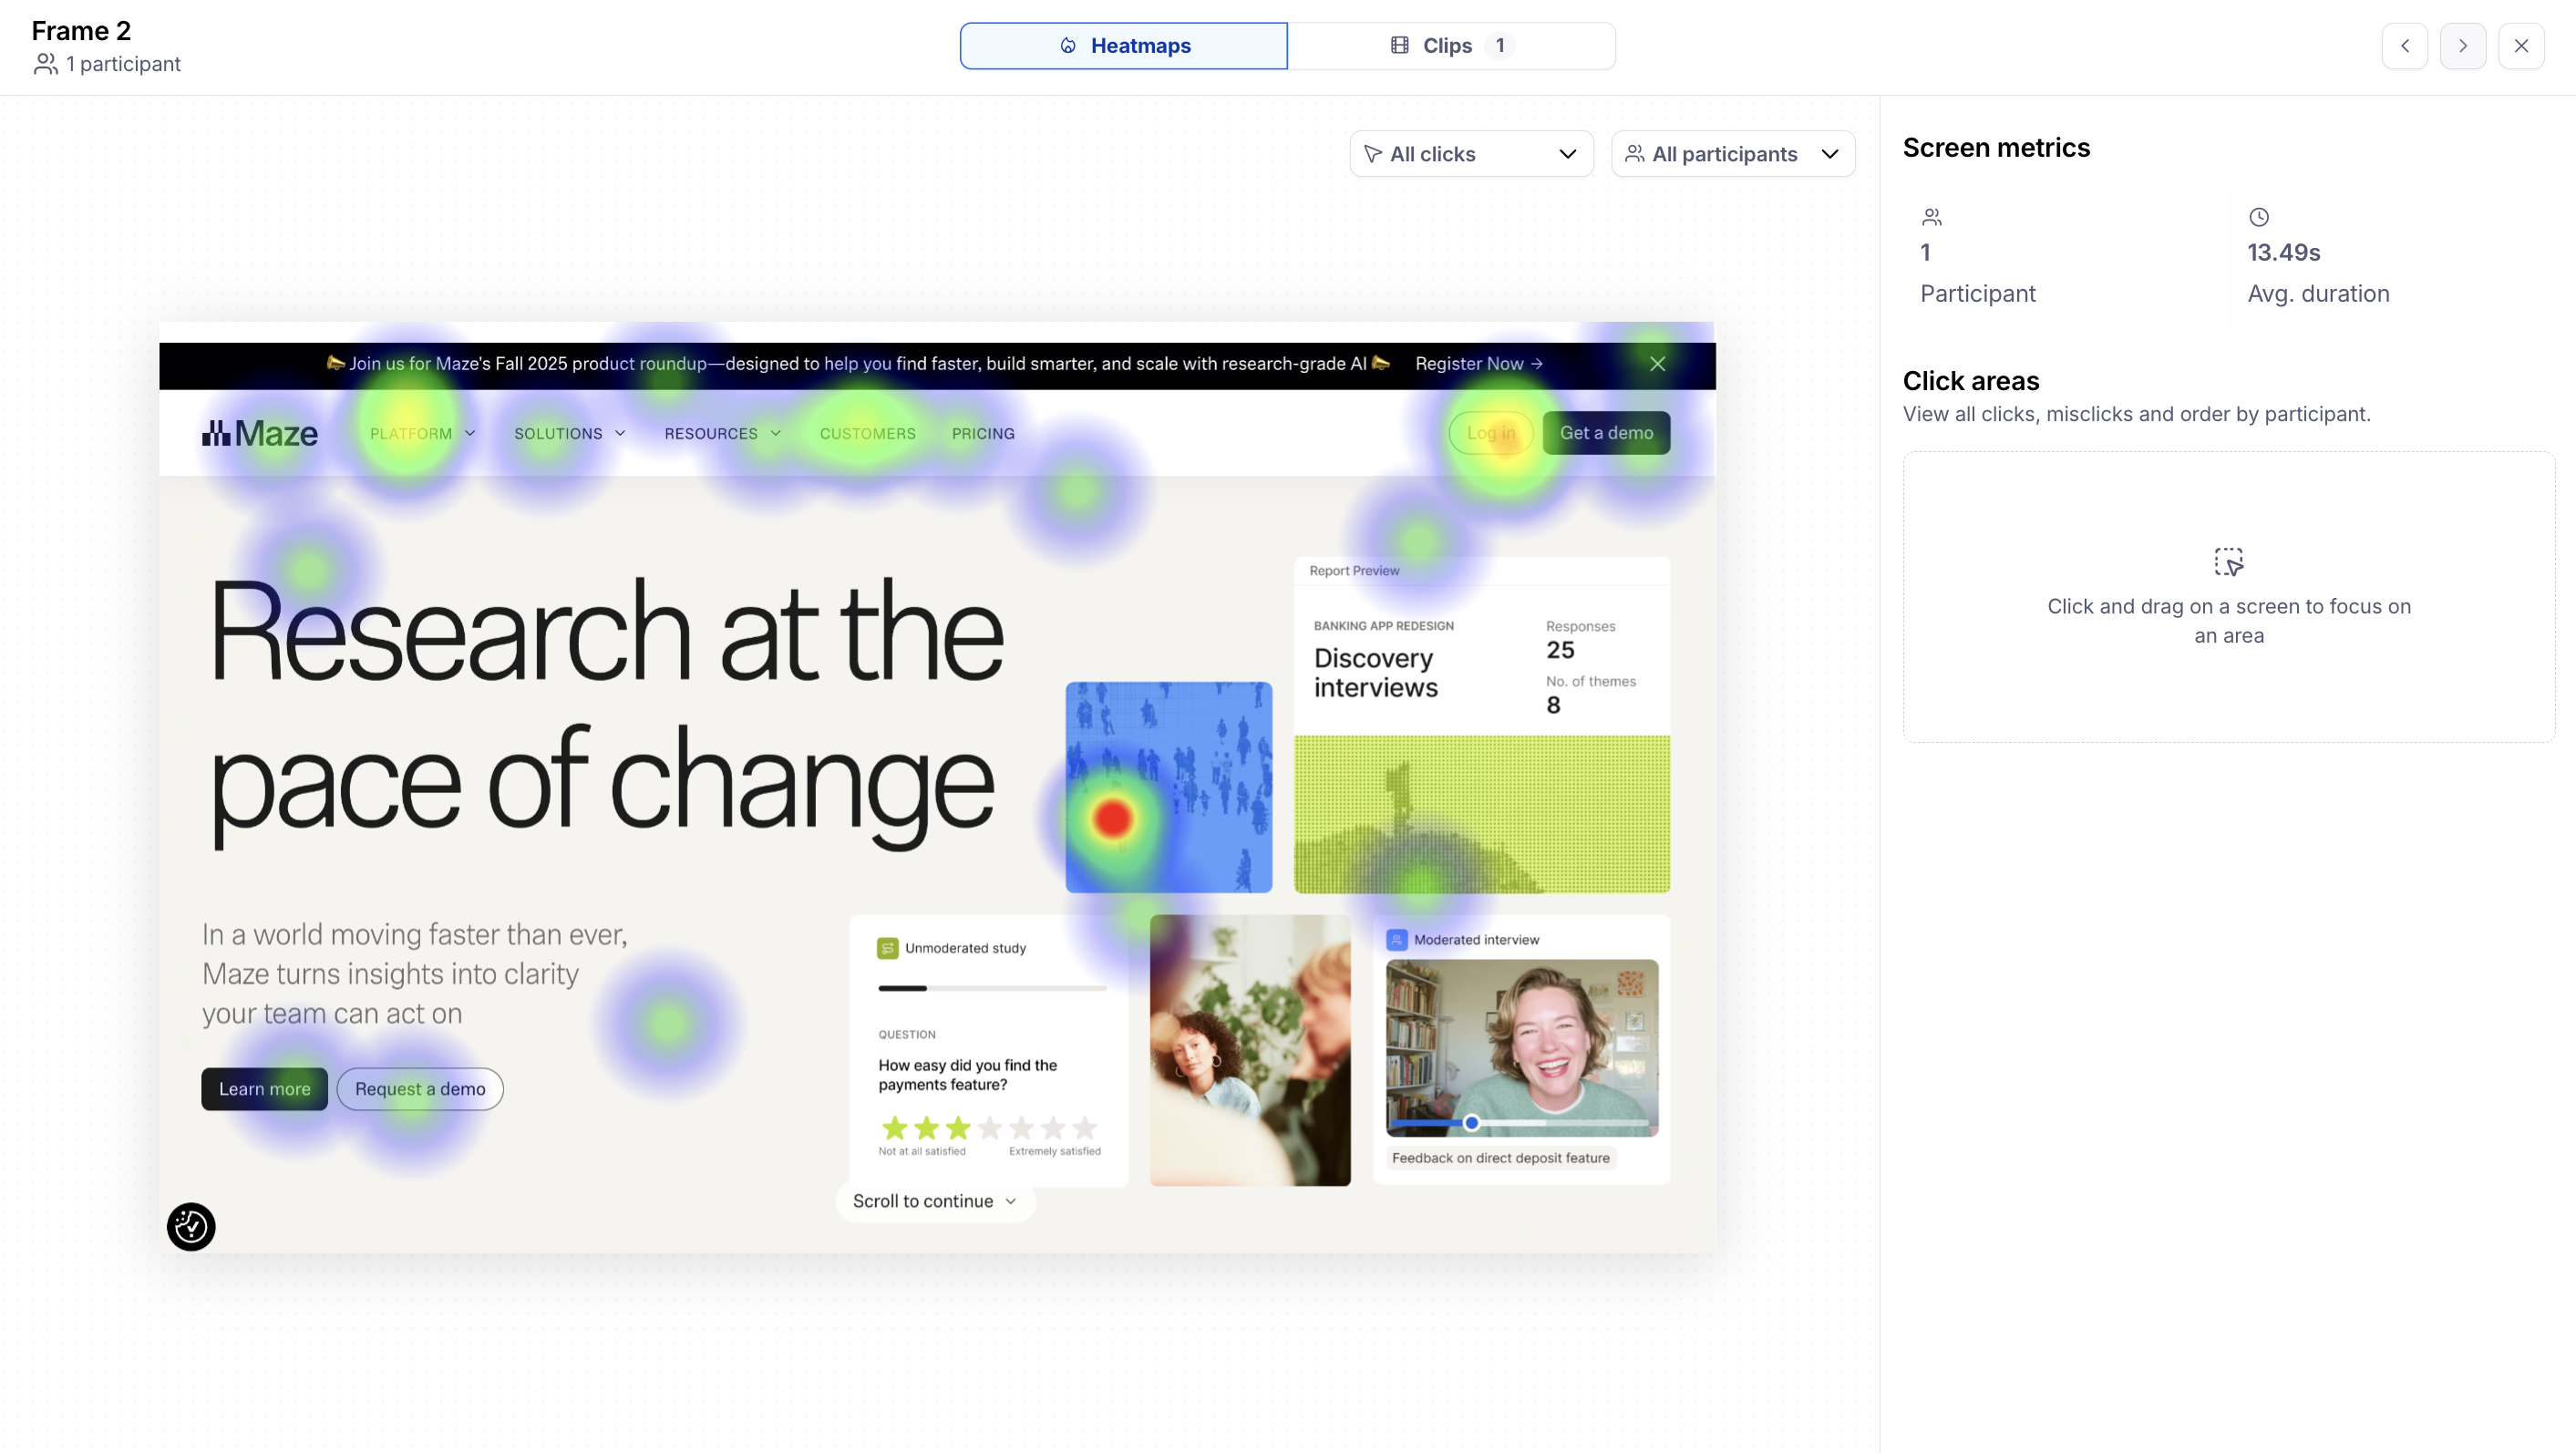
Using this workaround, you’ll be able to analyze participant behavior by looking into the heatmap data, both at the path/screen level and at the individual tester level.
Open the heatmap to see where your testers clicked first on the screen.
The average time spent on the screen may also be a helpful indicator. Too much time spent on the task suggests that the current design may not be effective.
Qualitative results: Clips analysis
If you enabled Clips on your first test, you can also see your recordings in the Results dashboard by clicking Watch Clips.
Learn more about finding Clips data in the Results dashboard
Still need help?
If you have any questions or concerns, please let our Support team know — we'll be happy to help!